Image Analysis
Image Analysis
Image Analysis is a module for manual image processing provided specifically for Stereo‑seq Chip. It includes easy‑to‑use functional modules for microscope image quality evaluation and manual adjustment (image stitching,image calibration tissue segmentation and cell segmentation). Image quality evaluation mainly evaluates the clarity and stitching quality of a image by referring to the background tracklines on the Stereo‑seq Chip in order to meet requirements for further downstream bioinformatics analysis. When automatic stitching or segmentation algorithm cannot satisfy the needs for further downstream analysis, manual adjustment modules can provide manual tools for image processing.
Image Stitching(Tiled FOV image only)
The image stitching module provides manual image stitching tools to adjust microscope stitching before running the standard automatic Stereo‑seq Analysis Workflow (SAW) pipeline.
Note: The prerequisite for running this module is that the tile image file has been generated .
Basic Operation
- Select a project on the DCS Cloud Platform.

- Click the "Image Analysis" module of "Tool".

- Click "Image Stitching".


- Select the files (IPR) to be manually stitched.

Users can search IPR files based on file name, SN number and task ID.
The supported types for opening files are: IPR
The storage path of the output file is: Data‑>ManualData

- Click "Confirm", the system will display the adapted stitching method based on the selected data and highlight it in yellow.

- If you choose "Manualadjustment of trackline template", the program will open the IPR file and TAR.GZ file which record the track point information of each FOV detected by Image Quality Control module. Each square displays the local view of each FOV image marked by the intersections of track points, which forms thelocalview according to the row and column numbers of all the FOV.

Note: For IF images, the system will generate a global map based on DAPI.
Click 'Do not remind again', the 'FOV description' banner will not be displayed again until the next start‑up.
Click 'Got it' to close the current banner. Click 'FOV Type' under 'View' to re‑open the banner.
If you choose "Manualadjustment ofFOV overlap"
- The program will open the IPR file and TAR.GZ file which record the track point information of each FOV detected by Image Quality Control module. Each square displays the global view of each FOV image marked by the intersections of track points, which form the global view according to the row and column numbers of all the FOV.


- Drag the slide bar of "Stitching Error Adjustment" to display algorithm detects a FOV greater than this error and marks it in red.The smaller the stitching error set by the user, the more red FOVs in the global large image.

Manual Adjustment of Trackline Template
The FOV marked with an M in the Global view is the template FOV, which is the best FOV evaluated by the trackline QC process. In order to estimate the image stitching performance, ImageStudio deduces the quality of trackline alignment of the stitched image according to the tracklines identified by the template FOV through a proprietary algorithm which checks whether the tracklines identified by the template FOV (in green) coincide with the tracklines of the bottom image.
Decription of each type of icon:
X:QC undetected track point, which requires user assistance to manually mark the track point.
M:Best template FOV determined via QC, which requires user assistance to confirm the quality of marked tracklines via algorithms.
○: Stitching error evaluated by the algorithm is less than 5 pixels, which requires user assistance to confirm the stitching quality.
○: Stitching error evaluated by the algorithm is greater than 5 pixels, which requires user assistance to manually mark the track points.
Suggested user actions:
Check whether the M point mark is correct. If not, manual adjustment of the M point mark is required.
Check for the FOV marked by red circles, since the stitching error evaluated by the algorithm for this FOV is greater than 5 pixels (required).
Check for the FOV marked with a red X (tracklines cannot be found by the algorithm). Users need to manually mark the track points (optional).
Check and confirm the FOV marked by green circles (optional).
FOV marked with the M point
Mainly adjust the trackline grid and align the algorithm generated trackline grid (in green) with tracklines on the Stereo‑seq Chip.
- Double click to open the FOV marker with an M point click the list of FOVs on the left to open.

- Drag the slide bar to enhance the image while pressing and holding Ctrl+ with mouse wheel to zoom in on the image, and confirm whether the template trackline grid (in green) aligns with the tracklines on the chip.

- If the tracklines are not aligned, right‑lick on the image and select 'Modify Trackline Grid'.

- Then, red and yellow trackline grids will appear. Trackline grids shown in red represent tracklines that are within focus whereas yellow trackline grids are tracklines that are out of focus. Rotation, sclaing and other manual operations can only be done on the red tracklin grids.

- Find a clear track point and left‑click to move the red trackline grids to the selected track point on the image.

- Zoom out the image, click the template to adjust the direction, adjust the horizontal and vertical directions, and ensure that the yellow line is aligned with the picture track, and the number of adjustments should not exceed 9 times at most.

- Left‑click on the plus and minus sign of ‘Rotation’ under 'Template Adjustment' to adjust the rotation angle of yellow trackline gird with red trackline grid as the center.

- Left‑click on the plus and minus sign of ‘Scale’ under 'Template Adjustment' to scale up and down the yellow trackline gird with red trackline grid as the center, respectively.

Other FOV (non‑template FOV)
Mainly adjust the track points marked with redX and ○.
- Double click on the FOV marked with redredX or ○ to start adjusting the position.


- Find a clear crossed track point then right‑click the intersection point to select ‘Add track point’. A green circle appears on the manually selected track point which can be repositioned to an actual trackline point on the chip. The green circle is shown as a red cross during repositioning to better align with the trackline on the chip.


- If unsatisfied with the repositioning, simply right‑click and select 'Move the Track Point to this position' to move the green circle to the point of selection.

- Once the modification is done, the default status after modification is set to ‘Confirmed’. If a certain FOV position is still unsured, set the status to Pending'.

- After modification, click "ssDNA tab" or "Home" return to the global view. The 'Confirmed' FOVs are indicated by a green circle and √ sign, while the 'Pending' for verification ones are indicated by a yellow exclamation sign.

- Once all the FOVs within the global view have completed modification, click’Run’. If 'Pending' FOV are left to be checked, the system will ask whether to run after checking.

- If all the FOVs have been confirmed, click’Run’and the system will initiate re‑stitching of the FOV images based on the manually selected track points for each FOV within the global view.

- Once the stitching process has been completed, a score will be given based on the evaluated re‑stitching quality and the system prompts whether to open and check the stitched image.

- Click 'Confirm' to open the image; The deduced template trackline will be mapped on to the image. Check whether the mapped trackline conincidice with the trackline on the Stereo‑seq Chip.

Manual Adjustment of The FOV Overlap
The FOV marked with a red circle in the stitched image is evaluated by the automatic algorithm when the stitching error of the FOV is greater than the set value (the default value is 5 pixels). Users can drag the "Stitching Error Adjustment" slide bar on the right and the number of red circles will gradually increase as the stitching error decreases.
- Double click to open the FOV marked with a red circle or click the list of FOVs on the left.

- The system generates an image composed of up to 9 FOVs. Drag the slide bar to enhance the image, you can click the "Stitching Adjustment" panel or press 'up and down', 'left and right' keys on the keyboard to adjust the position of the adjacent FOVs.

- The stitching effect of adjacent FOV images can be judged according to the score of OverLap or the degree the colors overlap with each other (yellow).

Note:The score range of OverLap is between 0 and 100. The higher the score, the higher the overlap of degree of the adjacent FOVs and the smaller the stitching error.
- After modification, click "Save"and click "ssDNA tab" or "Home" return to the global view. The modified FOVs are indicated by a green circle and a √ sign.

- If all the FOVs have been confirmed, click ’Run’ and the system will initiate re‑stitching of the FOV images based on the manually selected track points of each FOV within the global view.

- Once the stitching process has been completed, the system prompts whether to open and check the stitched image.

- Click 'Confirm' to open the image.

Tissue Segmentation
Tissue segmentation module is for manually adjusting the segmented tissue mask image.
Basic Operation
- Select a project on the DCS Cloud Platform.
- Click the "Image Analysis" module of "Tool".
- Click "Tissue Segmentation".


- Select the files (IPR).

Users can search IPR files based on file name, SN number and task ID.
The supported types for opening files are: IPR
The storage path of the output file is: Data‑>ManualData‑>Image‑>TissueSeg

- If the input is ssDNA or DAPI , two tabs will be opened and display the ssDNA or DAPI image or tissue mask image, Whether to display tissue mask image depends on whether the IPR file by user contains segmented Mask information.

If the input is DAPI with mIF:
- Two tabs will be opened and display the DAPI image or tissue mask image by default, Whether to display tissue mask image depends on whether the IPR file by user contains segmented Mask information.

- Users can choose whether to display other proteins by selecting the box under "Protein Tabs"on the right.

- The display of TESK2 protein is shown below.

- Users can choose whether to turn off the display of other proteins by deselecting the box under "Protein Tabs"on the right.

Note: Since generating the image pyramid is time‑consuming, please only open one Stereo‑seq Chip file at a time. One 1cm by 1cm Chip T will take about 3~5min to open.
Rectangle
This function mainly operates on the stitched image for extracting algorithm generated tissue mask file according to the box selected ROI via tissue segment algorithm.
- Click 'Rectangle' in thestitchedimage tab.

- User can chooseeither"Replace Mask" or "Update Mask", and the default option is to replace Mask.

Note:
"Replace Mask" extracts a new Mask according to the box selected ROI, which replaces the stitched Mask file.
"Update Mask" updates the corresponding Mask according to the box selected ROI, and the Mask of other areas remain unchanged.
- Box selects region of interest using the rectangle.

- Click 'Run'.

- Tissue segmentation algorithm will extract tissue Mask file according to the box selected ROI, write it into the IPR file.

- If the input data has not gone through tissue segmentation, a new "Mask" tab will be generated afterrunningtissue segmentation using rectangle tool.


Polygon
This function mainly operates on the stitched image for modifying algorithm generated tissue Mask file according to the manually drawn tissue contour using polygon selection and overlaying the stitched tissue Mask file. Multiple ROIs could be drawn using the polygon selection.
- Click 'Polygon' in the stitched image tab.

- Start with a point, left‑click to add points until an enclosed polygon has formed.

Note: Currently, overlapping of ROIs using polygon selection is not supported.
- Press and hold Enter on the keyboard to stop adding more points and enter polygon editing mode.

- Click on the points on the enclosed polygon trace then left‑click and hold to drag and reposition the shape of the polygon.

- Undo the point editing action by clicking 'Revoke' before saving.

- Click 'Save' after editing to write the new tissue Mask file into the IPR file.


- Click 'Cursor' to exit the polygon editing mode.
Brush
This function mainly operates on the Mask image for modifying algorithm generated tissue Mask file according to the manually drawn tissue Mask using a brush tool.
- Click 'Brush' in the Mask image tab.

- Click on the triangle icon next to 'Brush' to adjust the size of the brush. Range: [0, 1000], unit: pixel.

- Adjust 'Transparency' to get a clearer view of the tissue contour. Left‑click and hold to draw on the tissue Mask outline.

Note: Left‑click within the local view window to move the field of view.
- If mistakes were made, click 'Revoke' before saving to revoke current action.

- After drawing is completed, click 'Save' to update the tissue Mask image and write it into IPR file.

- Click 'Cursor' to exit the brush editing mode.
Eraser
This function mainly operates on the Mask image for modifying algorithm generated tissue Mask file with the eraser tool to manually erase unwanted tissue Mask region.
- Click 'Eraser' in the Mask image tab.

- Click on the triangle icon next to 'Eraser' to adjust the size of the eraser. Range: [0, 200], unit: pixel.

- Adjust 'Transparency' to get a clearer view of the tissue contour. Left‑click and hold to erase unwanted tissue Mask region.

Note: Left‑click within the local view window to move the field of view.
- If mistakes were made, click 'Revoke' before saving to revoke current action.

- After erasing is completed, click 'Save' to update the tissue Mask image and write it into the IPR file.


- Click 'Cursor' to exit the eraser editing mode.
Filling
This function mainly operates on the Mask image for manually filling vacancies in the tissue Mask image.
- Click 'Filling' in the Mask image tab.

- Right‑click to vacancies hole that need to be filled in the image, and thealgorithmwillfill in the vacanciesautomatically.

- Once completed, click 'Save' to update the tissue Mask image and write it into IPR file.

- Click 'Cursor' to exit the fillling editing mode.
Note: The vacancy is defined as a black region surrounded by a white tissue Mask area.
Filter
This function mainly operates on the Mask image for filtering background noise during imaging.
- Click 'Filter' and drag the bar to adjust the filtration parameters.

- View the filtering results in the Mask image tab.

- Click 'Save' to update the tissue Mask image and write it into IPR file.


- Cursor, brush and eraser tools can be used simultaneously.
Threshold
The display of a protein signal intensity can be enhanced or diminished by adjusting the cut‑off threshold of the protein mask image.
- On the page of a protein mask, adjust the "transparency" to better reflect the overlapping region between thestitchedimage and the Mask image.

- Click on the 'eye icon' to hide or display the other proteins under the tab. Avoid the presence of other proteins that may cause background noises on the current protein image.

Note: The image layer are displayed from bottom to top in tab's sequential order from left to right, e.g. in this case, DAPI is the bottom layer.
- On the Protein Mask page, adjust"Threshold".

Note:It is recommended to adjust the Mask's threshold value first, and then adjust it with other tools such as brush and eraser.
- After the adjustment, click reset to restore the default value if necessary.

- If mistakes were made, click 'Revoke' before saving to revoke current action.

- After all protein adjustment is completed, click "Save" and the updated Mask is written into IPR file.

- Users can use cursors, brushes, and eraser at the same time.
Labeling
Different from tissue segmentation which marks the region for the entire tissue, the labeling function allows users to mark multiple regions of the tissue which can be used in pathological annotation. Users may use the polygon tool, brush, and/or eraser to create labels for cancer, tumor, normal, or any region of interest. The labels can be defined and edited in HE_Label tab.
Note:The Labeling function in Version 3.0.x is only available for H&E images.
- Click "Labeling" to launch labeling mode. A new "HE_Label" tab will be generated and a new "Label Tabs" will be displayed on the right side.

- Select "New Label", enter the label name and notes in the pop‑up box and click "Confirm" to create a label tag.


Note: A valid label name can contain only letters, numbers, and underscores.
- Users can manually mark tissue areas of interest using polygons, brushes, and erasers.Then, use polygon, brush, and eraser tools to delineate the region belonging to the label that created earlier.

- Click "Revoke" to undo the last action. Only valid before saving.

- Click "Save" to convert the drawing to the label displayed in the "Label Tabs" section with a program‑assigned color, and then write the label mask into the IPR file.

- Click the eye icon in front of the label to show or hide a label layer. Select "show all" or "hide all" to show or hide all labels together.


- Click "delete label" icon to remove a label.

Edit label:
Click "edit label" icon to start editing the label name and remark.

Click "Confirm" to finish editing the label name and remark, and allow you to edit the label region with polygon, brush, and eraser. Press "ESC" to exit editing mode.
Select polygon or brush tool to manually add regions, and select eraser to remove regions.

Note: Recommend to hide other labels while editing, to avoid any interferences on other labels.
- Click "Save" to save edited labels into the IPR file.
Cell segmentation
Cell segmentation module is for manually adjusting the segmented cell mask image.
Basic Operation
- Select a project on the DCS Cloud Platform.
- Click the "Image Analysis" module of "Tool".
- Click "Cell Segmentation".


- Select the files (IPR).

Users can search IPR files based on file name, SN number and task ID.
a) The supported types for opening files are: IPR
b) The storage path of the output file is: Data‑>ManualData‑>Image‑>CellSeg

- If the input is ssDNA or DAPI , two tabs will be opened and display the ssDNA or DAPI image or cell mask image, Whether to display tissue mask image depends on whether the IPR file by user contains segmented Mask information.

If the input is DAPI with mIF:
- Two tabs will be opened and display the DAPI image or tissue mask image by default, Whether to display tissue mask image depends on whether the IPR file by user contains segmented Mask information.

- Users can choose whether to display other proteins by selecting the box under "Protein Tabs"on the right.

- The display of AKAP3 protein is shown below.

- Users can choose whether to turn off the display of other proteins by deselecting the box under "Protein Tabs"on the right.

Note: Since generating the image pyramid is time‑consuming, please only open one Stereo‑seq Chip file at a time. One 1cm by 1cm Chip T will take about 3~5min to open.
Rectangle
This function mainly operates on the stitched image for extracting algorithm generated cell Mask file according to the box selected ROI via cell segment algorithm.
- Click 'Rectangle' in the stitched image tab.

- User can chooseeither"Replace Mask" or "Update Mask", and the default option is toupdatemask.

Note:
Replace Mask" extracts a new Mask according to the box selected ROI, which replaces the stitched Mask file.
"Update Mask" updates the corresponding Mask according to the box selected ROI, and the Mask of other areas remain unchanged.
- Box selects region of interest using the rectangle.

- Click 'Run'.

- Cell segmentation algorithm will extract cell Mask file according to the box selected ROI,overlaythestitchedMask file, and write it into the IPR file.

- If the input data has not gone through tissue segmentation, a new "Mask" tab will be generated afterrunningtissue segmentation using rectangle tool.


Polygon
This function mainly operates on the ssDNA image and Mask image for modifying algorithm generated cell Mask file according to the manually drawn cell contour using polygon selection and overlayinging the stitched cell Mask file. Multiple ROIs could be drawn using the polygon selection.
- Click 'Polygon' in the ssDNA image or Mask image tab.

- Find the cell that needs to be modified, start with a point, then left‑click to add points until an enclosed polygon has formed.

- Press and hold Enter on the keyboard to stop adding more points and enter polygon editing mode.

- Click on the points on the enclosed polygon trace then left‑click and hold to drag and reposition the shape of the polygon.

- Undo the point editing action by clicking 'Revoke' before saving.
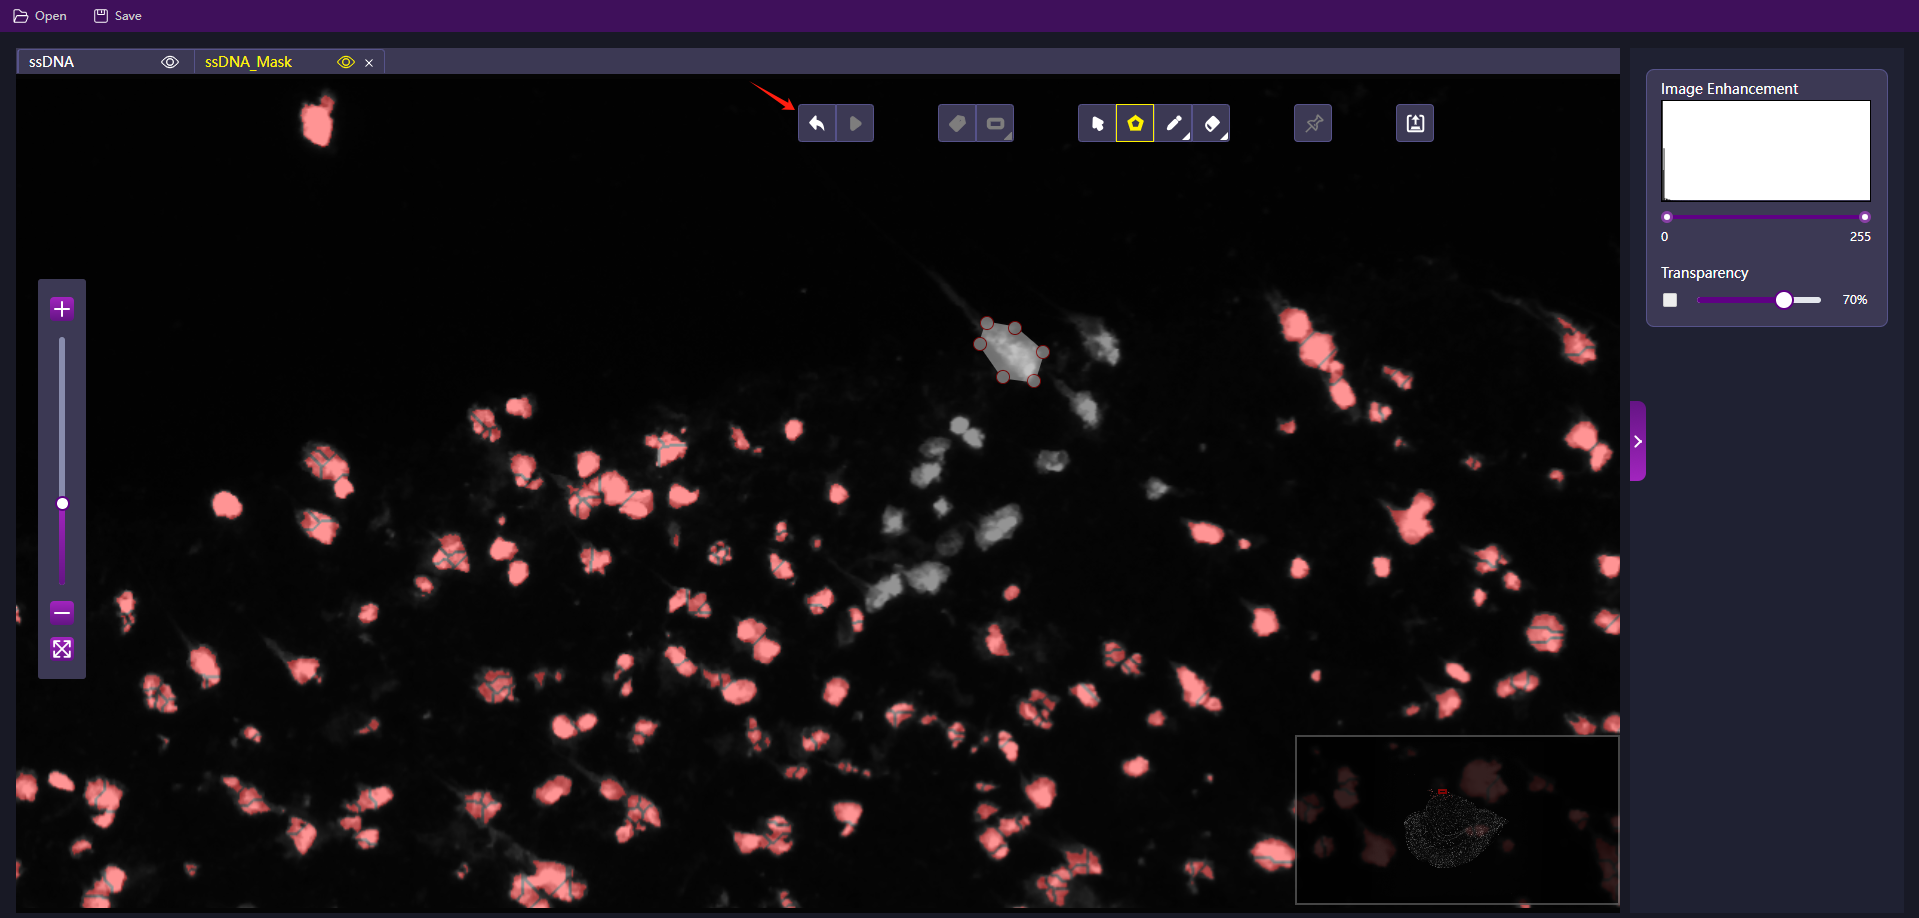
- Click 'Save' after editing to write the new cell Mask file into the IPR file.

- Click 'Cursor' to exit the polygon editing mode.
Brush
This function mainly operates on the Mask image for modifying algorithm generated cell Mask file according to the manually drawn cellMask using a brush tool.
- Click 'Brush' in the Mask image tab.

- Click on the triangle icon next to 'Brush' to adjust the size of the brush. Range: [0, 50], unit: pixel.

- Adjust 'Transparency' to get a clearer view of the cell contour. Left‑click and hold to draw on the cell Mask outline.

Note: Left‑click within the local view window to move the field of view.
- If mistakes were made, click 'Revoke' before saving to revoke current action.

- After drawing is completed, click 'Save' to update the cell Mask image and write it into IPR file.


Note: Updated cell mask will shown in red.
- Click 'Cursor' to exit the brush editing mode.
Eraser
This function mainly operates on the Mask image for modifying algorithm generated cell Mask file with the eraser tool to manually erase unwanted cell Mask region.
- Click 'Eraser' in the Mask image tab.

- Click on the triangle icon next to 'Eraser' to adjust the size of the eraser. Range: [0, 100], unit: pixel.

- Adjust 'Transparency' to get a clearer view of the cell contour. Left‑click and hold to erase unwanted cell Mask region.

Note: Left‑click within the local view window to move the field of view.
- If mistakes were made, click 'Revoke' before saving to revoke current action.

- After erasing is completed, click 'Save' to update the tissue Mask image and write it into the IPR file.


- Click 'Cursor' to exit the eraser editing mode.
Cell Marker
This function mainly operates on the Mask image for rapidly identifying cells in sparse tissue area through clicking on the cell region.
- Click 'Cell Marker' in the Mask image tab.

Note: Try to achieve a greater contrast between the tissue area and the background by adjusting image enhancement in the ssDNA tab before using the Cell Marker function.
- Right‑click on the cell of interest to obtain the cell Mask. Multiple clicks are supported.

- Once completed, click 'Save' to update the cell Mask image and write it into the IPR file.

Note: Since it takes some time to save the files, we suggest marking down all the cells of interest before saving.
- Click 'Cursor' to exit the Cell Marker editing mode.
Image Calibration
The Image Calibration module is designed to align two images into one coordinate system based on their morphological features. The transforming options include pan moving in the horizontal or vertical direction, small angle rotation, scale, etc.
Note: The Image Calibration function in Version 2.1.x‑3.0.x is only available for DAPI&mIF images. The input files should be DAPI & mIF images that have been compressed by the QC module.
Basic Operation
- Select a project on the DCS Cloud Platform.
- Click the "Image Analysis" module of "Tools".
- Click "Image Calibration".


- Select the files (IPR).

Users can search IPR files based on file name, SN number and task ID.
a) The supported types for opening files are: IPR
b) The storage path of the output file is: Data‑>ManualData‑>Image‑>Calibration

- Click "Confirm" the tabs will be opened and display the DAPI and protein image.


Note: Since generating the image pyramid is time‑consuming, please only open one Stereo‑seq Chip file at a time. One 1cm by 1cm Chip T will take about 3~5min to open.
Calibration Adjustment
- Open the file and the "Calibration Adjustment" panel on the protein page.

- Drag the 'Transparency Adjustment' slide bar under the Mask tab to adjust the transparency of cell mask image for a clearer view the reflect the degree of overlap between protein and DAPI.

- Click on the 'eye icon' to hide or display the image under the tab, avoid the presence of other proteins that may cause background noises on the current protein image.

Forthe protein page:
- If the protein image has offset with DAPI in the horizontal or vertical direction, click the arrows in the "Calibration Adjustment" panel on the right to move the protein image.

- If the protein image needs to rotate a small angle to match with DAPI, adjust the image with the "Rotation adjustment" function. "+" rotate the image counterclockwise, and "‑" rotate the image clockwise.

- If the protein image needs to be resized to match with DAPI, adjust the image with the "Scale adjustment" function. "+" will size the image up, and "‑" will size the image down.

Note:
The user can enter the step size as required. The default step size of "Calibration Adjustment" is 1 pixel.
Users can press 'up and down', 'left and right' keys on the keyboard to move the position of the protein in the horizontal and vertical directions.
- If mistakes were made, click 'Revoke' before saving to revoke current action.

- If you want to redo the previous operation after multiple revoke, click "Redo".

- If some proteins are not calibrated, click "Save". The system will prompt you whether all proteins are calibrated.

If you click "Cancel", the system returns to the screen before saving.
If you select "Confirm", the updated information will write it into the IPR file.
Note: Since generating the image pyramid is time‑consuming during the saving process, it is recommended to save after all protein adjustment is completed.
Data path description of manual image
The conditions under which manually operated data can be displayed in Data are as follows:
After completing the manual operation, click "Save" and perform the following two operations. The data will be written to Data, and the user can submit the subsequent analysis process.
After closing the current page for 5 minutes, the system will write the data to Data.
If there are no new operations within 30 minutes, the system will automatically write the data to Data.
Click "Run Workflow", the system will write the data to Data and pop up the interface to fill in the parameters.
Each module can be viewed in the following path of DATA.
| Module | Data path |
|---|---|
| Image Stitching | ManualData\Image\Stitch |
| Image Calibration | ManualData\Image\Calibration |
| Tissue Segmentation | ManualData\Image\TissueSeg |
| Cell Segmentation | ManualData\Image\CellSeg |
Note: Due to the large time and memory consumption of "Save", it is recommended that users click "Save" after completing all manual operations.
Run Workflow Description
- After the manual operation is completed, click the "Run Workflow" button, select the corresponding workflow, and the process parameter selection will appear.

- SAW‑ST‑V6/V7: It is mainly suitable for data that succeed image QC. After the manual operation is completed, the process can be submitted directly on this page.

- SAW‑ST‑V6/V7‑count: It is mainly applicable to data that failed image QC. The process can be submitted after manual completion.

- SAW‑ST‑V6/V7‑recut: It is mainly suitable for data that succeed image QC. This process can be used for manual tissue segmentation or cell segmentation after running the standard analysis process.

- SAW‑ST‑V6/V7‑Registration: It is mainly suitable for data that succeed image QC. This process can be used after manual stitching, and the parameters are automatically filled.

If the manual data is a standard analysis task such as spatial_RNA_visualization_v5 or spatial_RNA_visualization_v6, after manually processing the image, the manual IPR will be directly output, and the user can submit the task in Workflow or Chip.
Check the status of the process in Task .
