Lowpass User Manual
Lowpass User Manual
1. Chapter 1 Product Information
1.1 Product Description
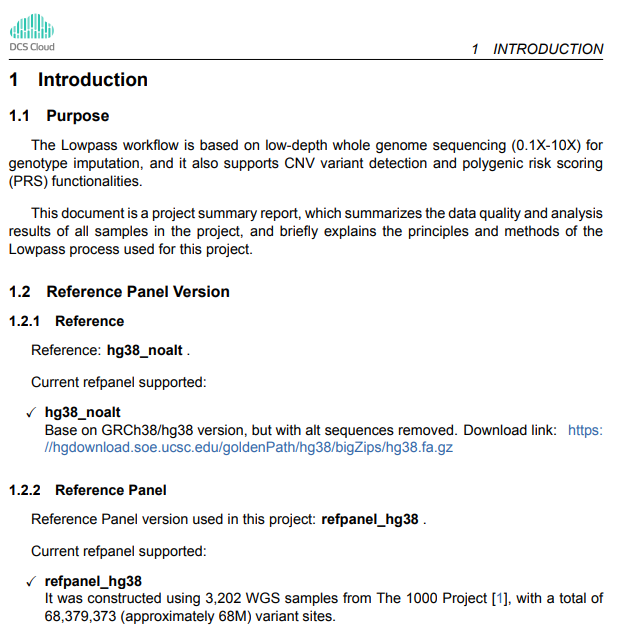
The Lowpass pipeline is based on low-depth whole-genome sequencing (0.1X-10X) for genotype-imputation and supports features such as CNV variant detection and polygenic risk score (PRS). The workflow includes data alignment, quality control, variant detection, imputation, and report generation. The process analysis and management of parameter input and report output is carried out through the graphical interface of the DCS Cloud platform, which is easy to use. The process uses a high-performance server configuration, and the tasks are parallelized, shortening the analysis cycle and achieving fast and efficient delivery.
1.2 Precautions
Specially analyze the process of lowpass whole genome sequencing (LP-WGS).
Process name: Lowpass_v5 main process (generates a single sample html report); LowpassSummary_v5 process (can be used to generate multi-sample reports or single-sample delivery reports).
The current process only supports two species: humans and pigs. If there are demands for new species in the future, it will be updated iteratively.
The latest version: V1.2.0, released on: 2024.11
2. Chapter 2 Product Introduction
2.1 Analysis Flow Chart
The Lowpass process is a process that specifically analyzes LP-WGS data. Based on the haplotype reference panel information, the missing genotypes in the offline data of low-depth whole genome sequencing were inferred and genotype-imputation was performed. At the same time, human samples support functions such as CNV variant detection and polygenic risk score (PRS).
The process includes the following features:
Data comparison: Compare according to the reference genome, generate and statistically compare the results.
Variant detection: According to the comparison results, the mutation results of the analyzed samples include SNPs and INDELs.
Imputation: Inference and genotypic imputation of missing genotypes are performed based on the haplotype reference sequence set.
Report generation: Analyze the results and organize them into HTML and PDF reports.
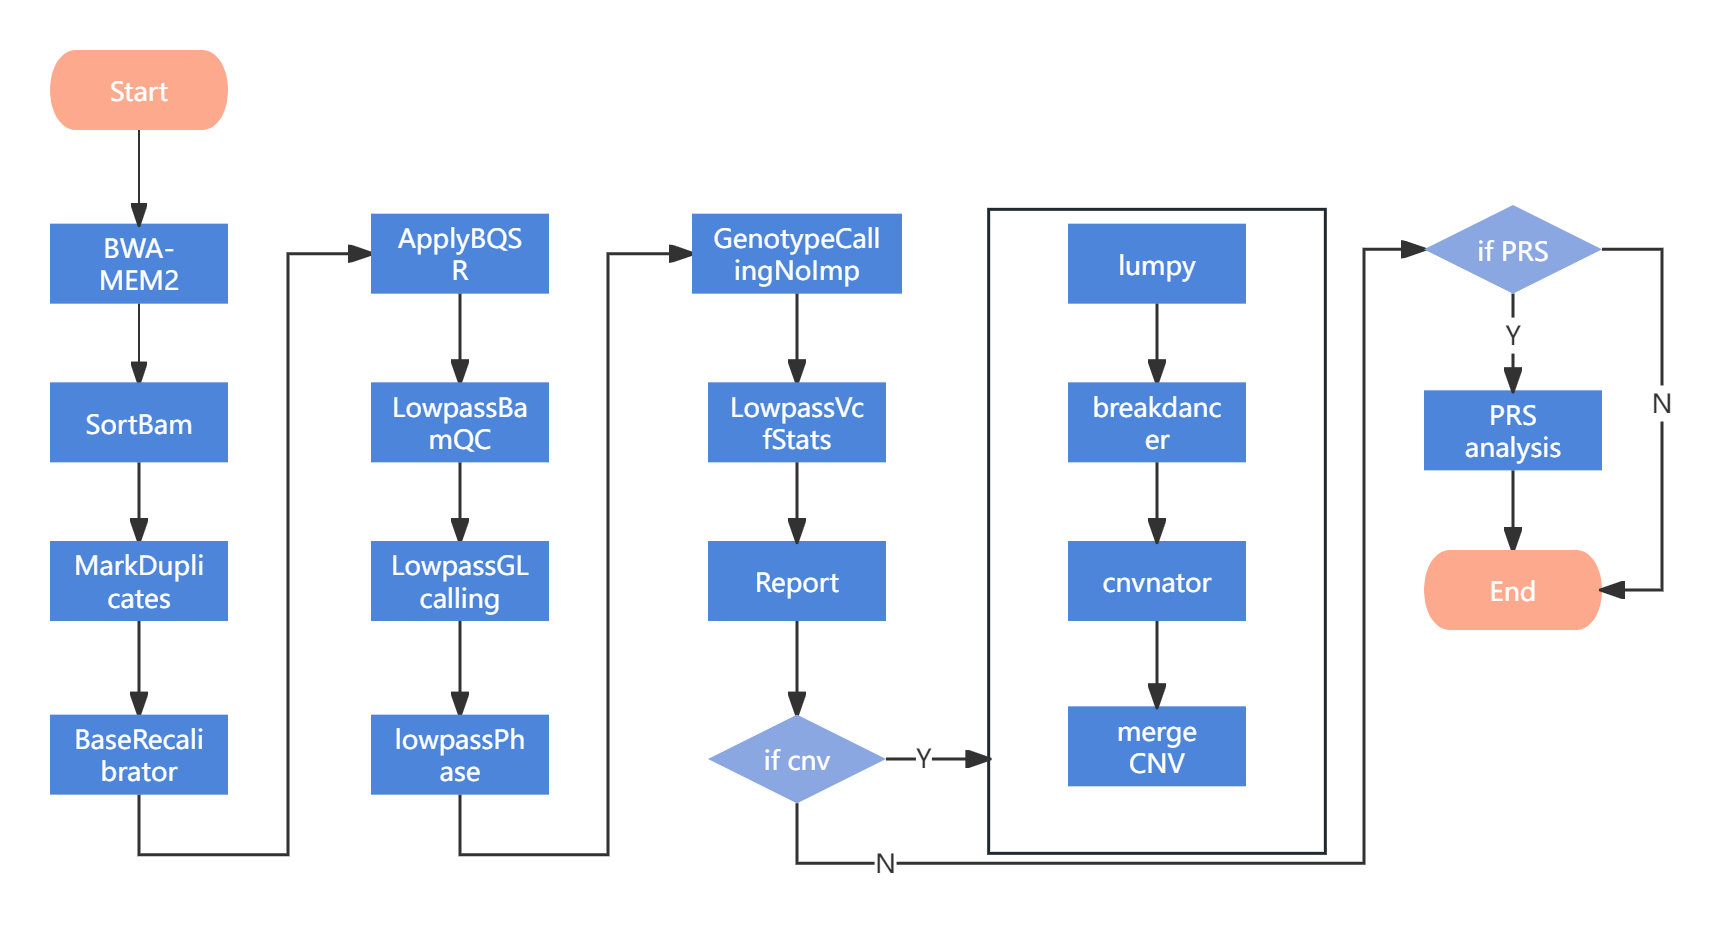
2.1.1 Reference genome alignment
Use BWA to align the Raw Fastq file to the reference genome and then pass the output to the samtools tool to convert it into a BAM file.
2.1.2 Sort and MarkDuplicates
The generated bam file was analyzed and aligned by GATK and sorted according to the chromosome position. The duplicates were then marked to output the bam file containing duplicate statistics and the corresponding bai index file.
2.1.3 Base Quality Score Recalibration
Using the BaseRecalibrator tool in GATK, the bam file was identified and corrected by sequencing data from the reference genome and vcf files containing known SNP loci, and the realignment table file was generated. Subsequently, using the ApplyBQSR tool, the base mass score was recorrected for the bam according to the recorrection table file in the previous step. Finally, the quality control is completed by running a java script.
2.1.4 Variant calling and genotype imputation
With reference genome, dbSNP files and other data information, genotype likelihood values are introduced, the input bam files are labeled, and then the genotype call is filled with the HaplotypeCaller tool.
2.1.5 Analysis and report output
Analyze the results and compile them into HTML and PDF reports.
3. Chapter 3 Instruction Manual
The Lowpass standard analysis process manages the whole process of sample input and report output through the STOmics spatio-temporal cloud platform system. The following describes the operation guide for using the Lowpass standard analysis process based on the STOmics spatio-temporal cloud platform system.
3.1 Overview of the guide
3.1.1 Overview
This chapter describes how to use the Lowpass standard analysis process for analysis. Please read and understand the contents carefully before using it to ensure that you can use the Lowpass correctly.
3.2 Scenario 1: Manual delivery
There are four steps: upload data, add workflow, Lowpass analysis, and output report from LowpassSummary. After running the task, when the customer sees that the task status is completed, it means that the task has been completed, and the report section can be viewed (see section 3.4 for details).。
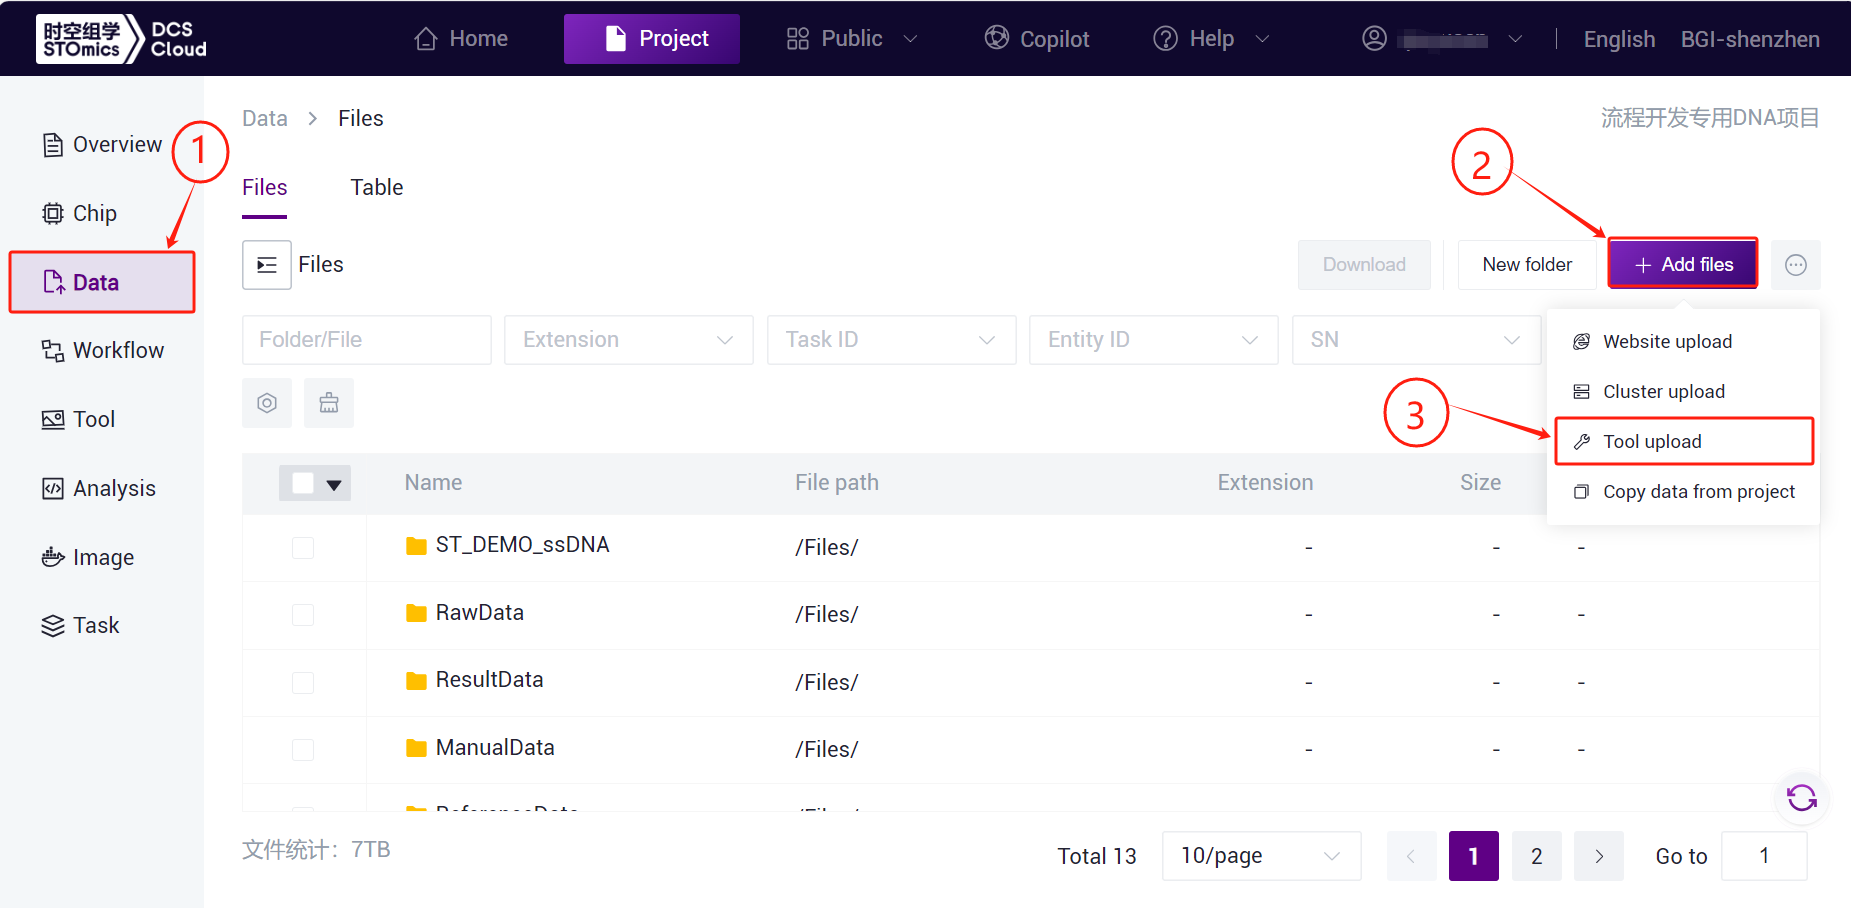
3.2.1 Step 1: Upload data
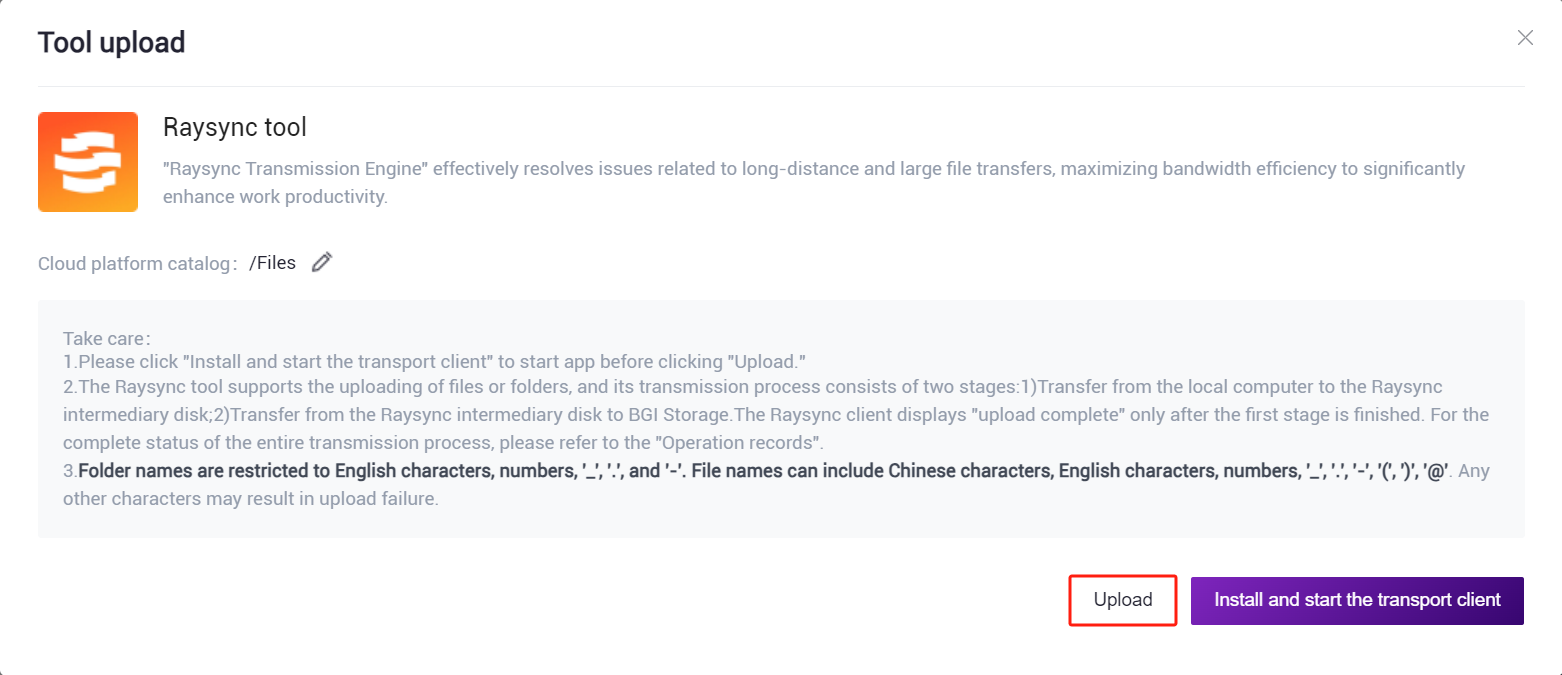
- Click the left-hand navigation bar【Data】, go to the data management page, go to the destination folder, and click the upper right corner【+Add files】-【Tools upload】upload data ( Figure 3-1 ) :
- Click 【Upload】 browse and select the desired file ( Figure 3-2 ) After the upload is complete, the file will be displayed in the destination folder (if it is the first time you upload it, you need to click 【Install and start the transport client】 to install the required tools):
3.2.2 Step 2: Add a workflow
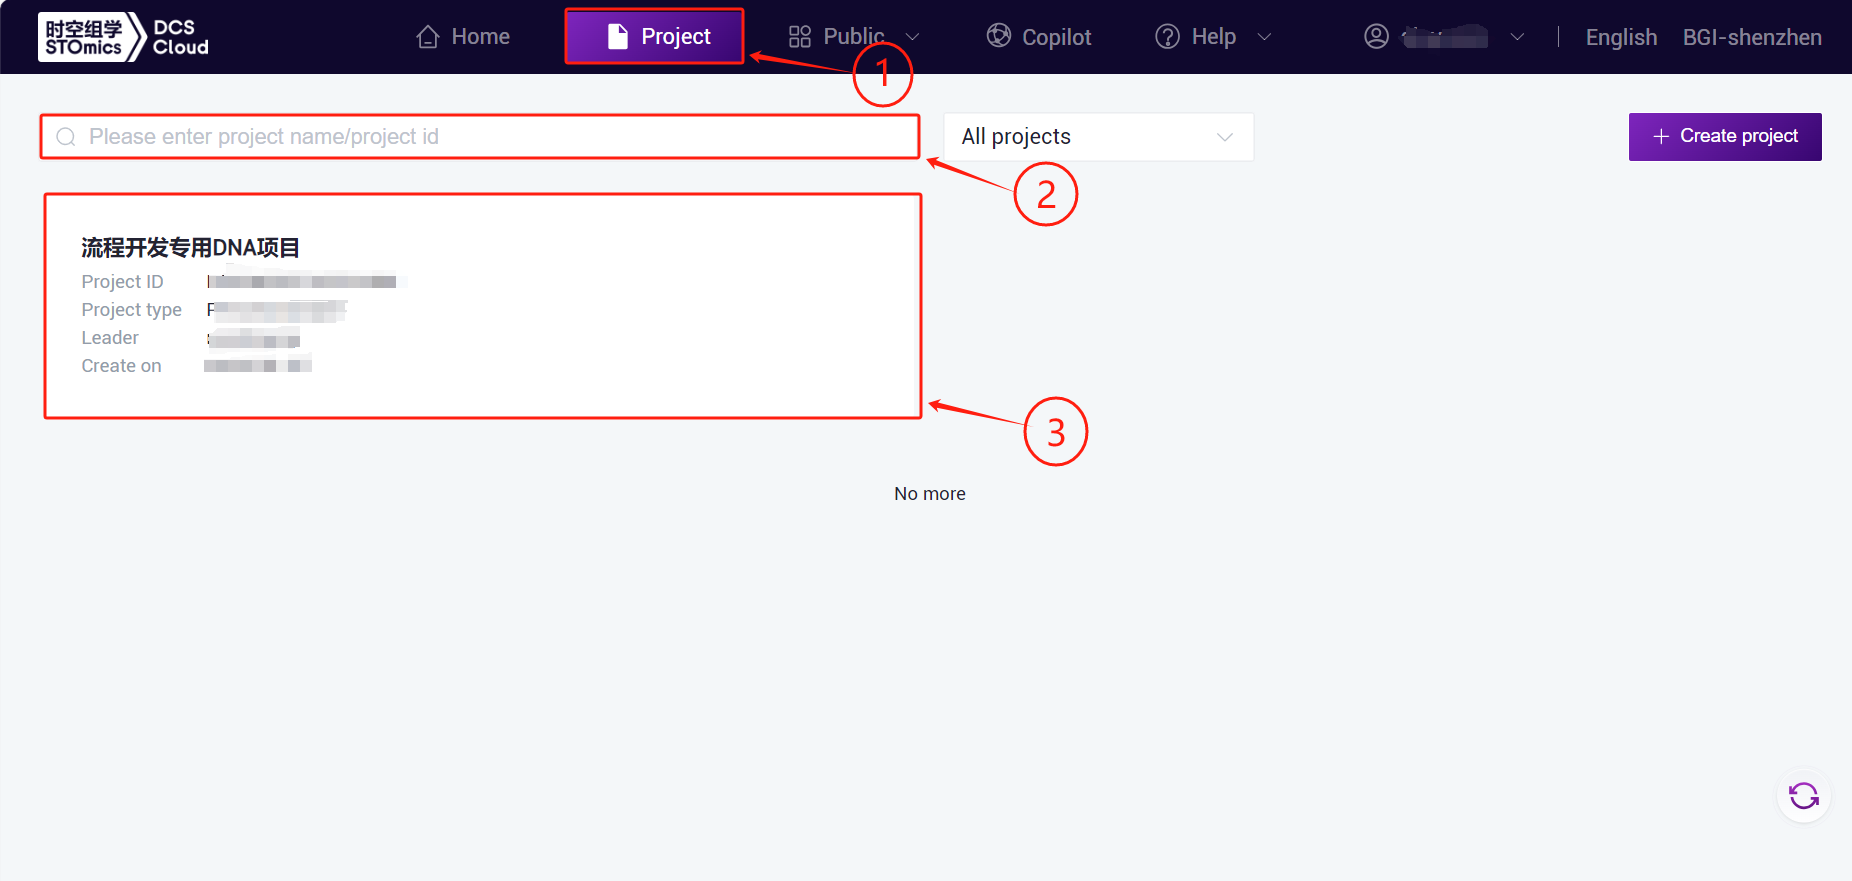
- Click the top navigation bar【Project】 go to the project list page and enter it in the search box project name/project id, click enterProject( Figure 3-3 ) .
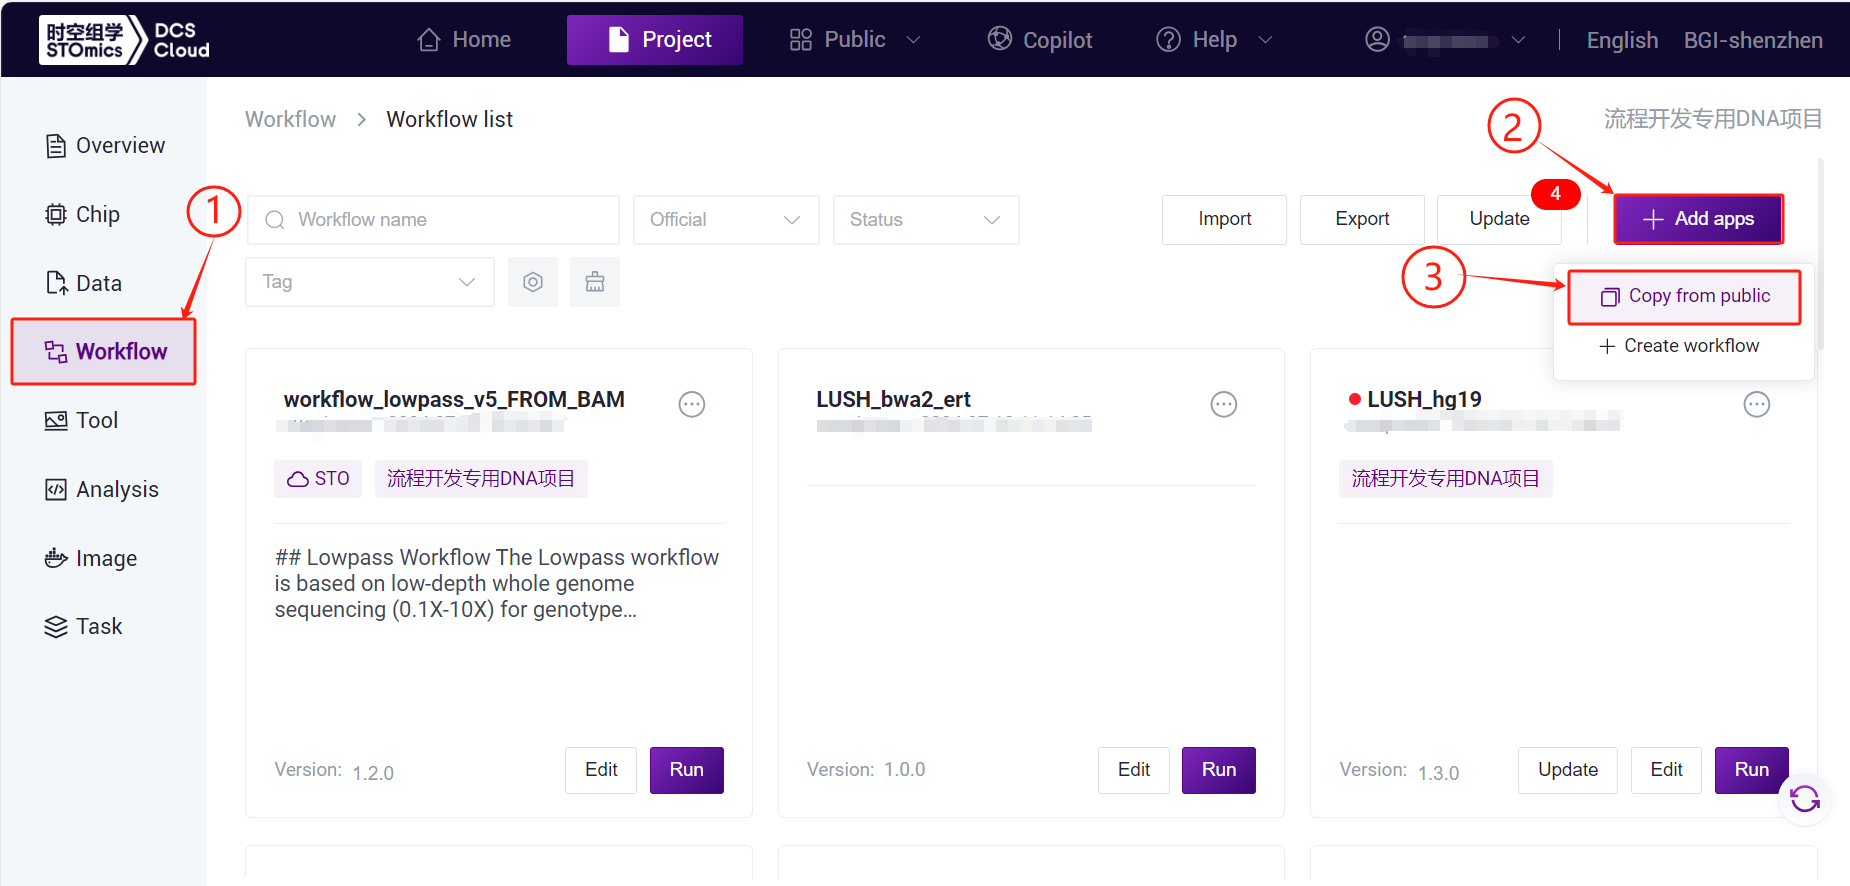
- Click the left-hand navigation bar【Workflow】 go to the process analysis page and click on the upper right corner 【+ Add apps】 to add a workflow, click 【Copy from public】 ( Diagram 3-4 ) .
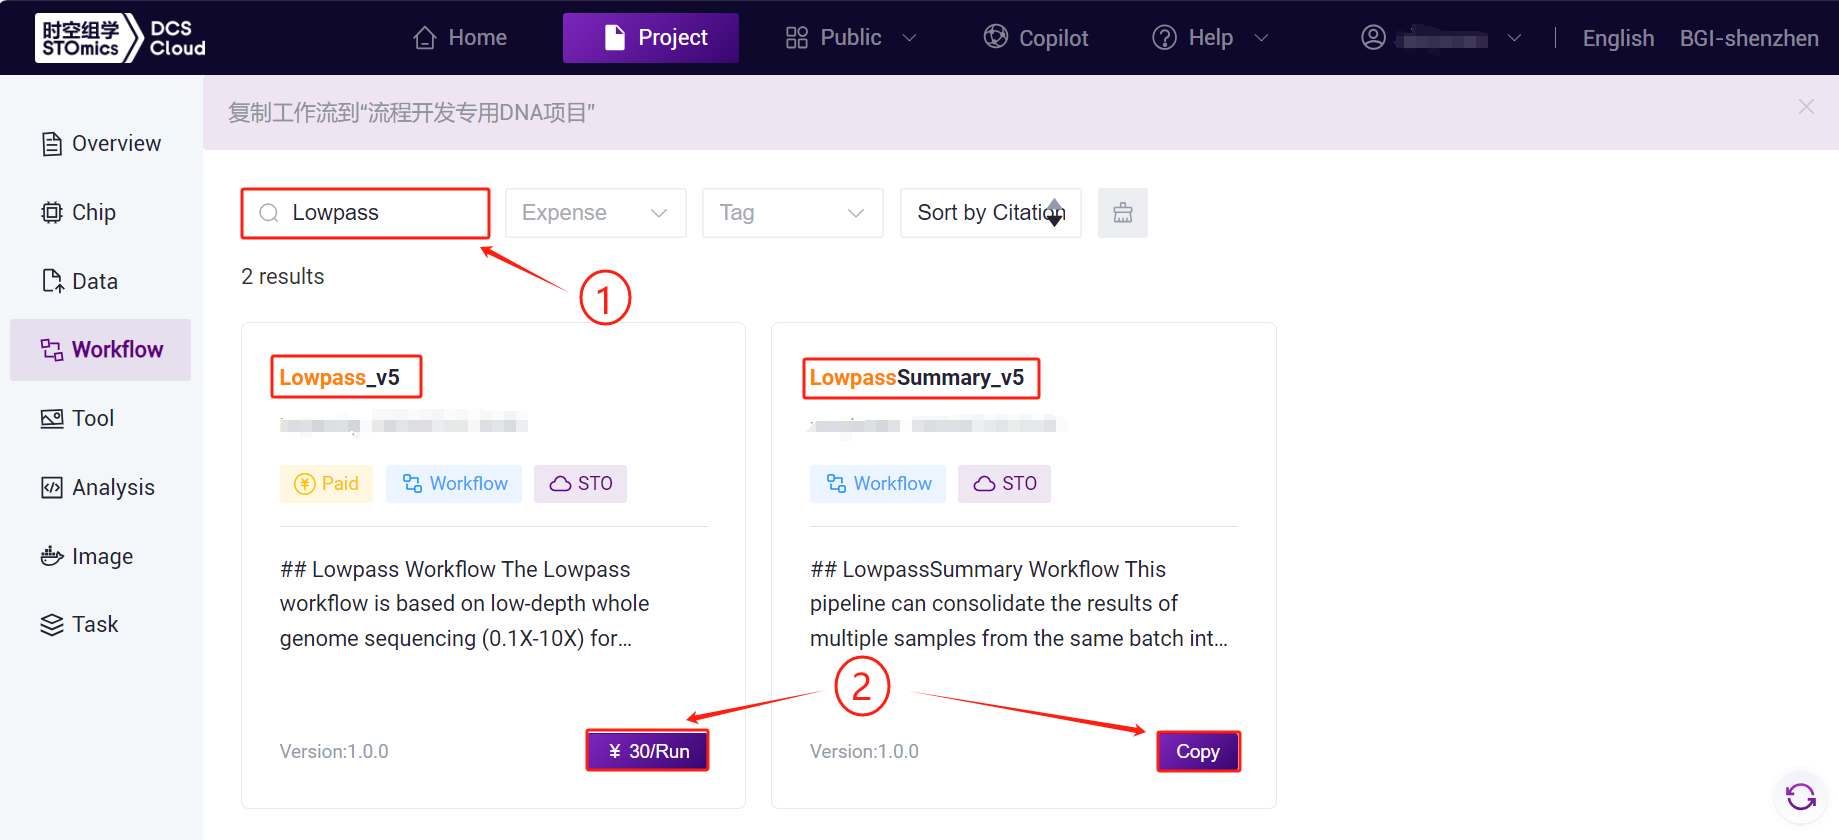
- EnterLowpassin the search box , selectLowpass_v5, click 【¥30/Run】 to go to the next step, and then select again LowpassSummary_v5, click 【Copy】 , skip to step 5 ( Figure 3-5 ) :
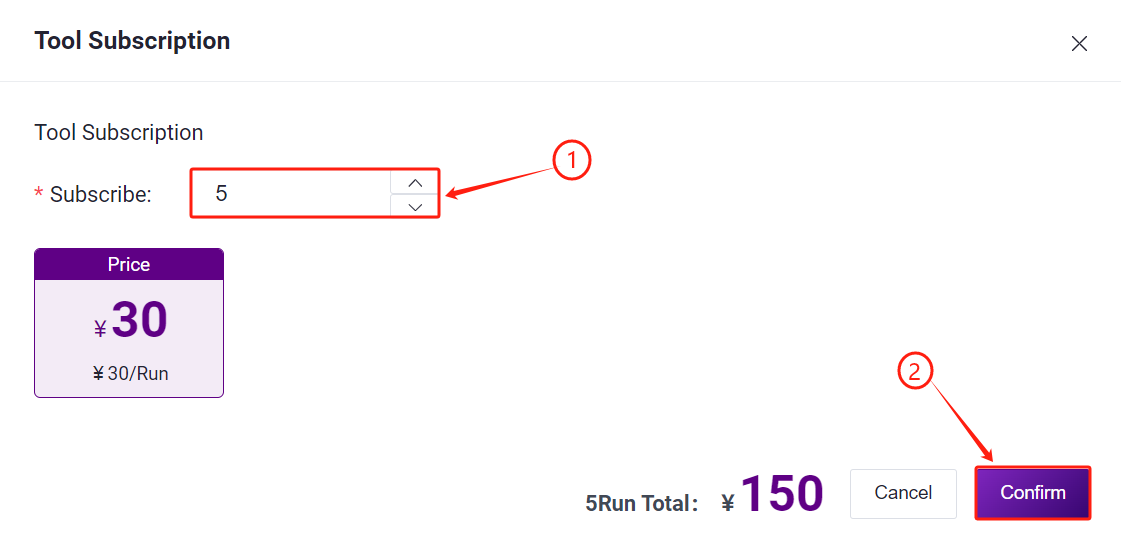
- Set the number of subscriptions, and when you're done, click【Confirm】 ( Figure 3-6 ) :
- The workflow was added ( Figure 3-7 and Figure 3-8 ) :


3.2.3 Step 3: Lowpass analysis
- Click the left-hand navigation bar【Workflow】 go to the Process Analysis page and enter Lowpass in the search box , click 【Run】 ( Figure 3-9 ) :

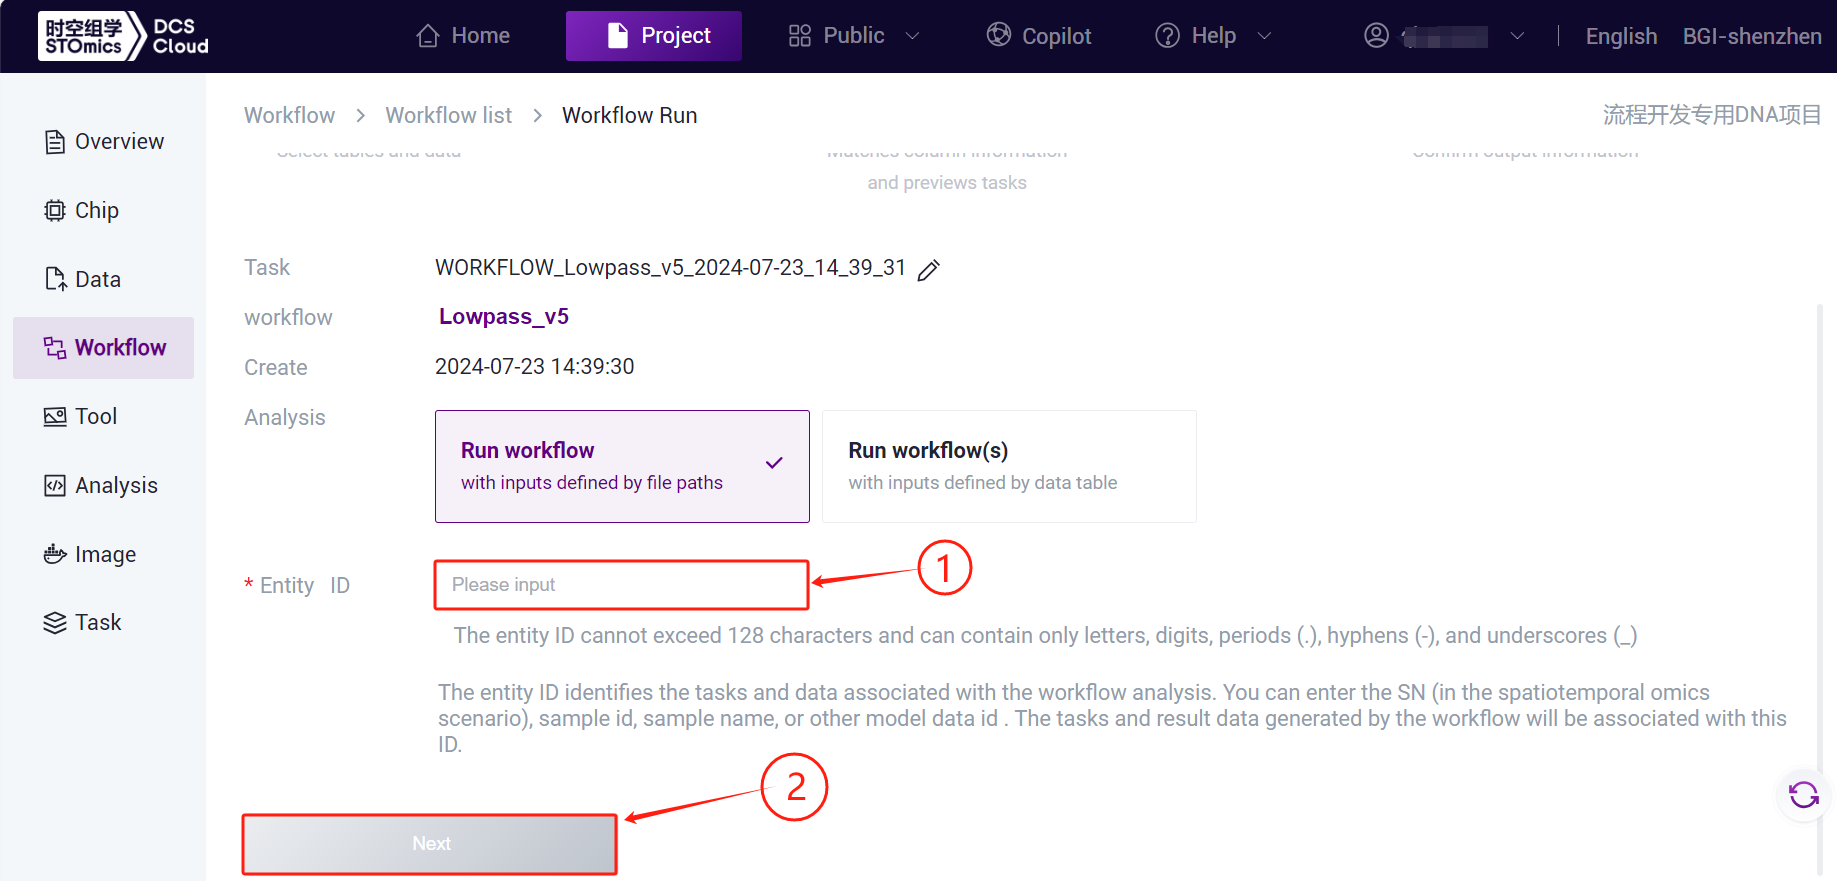
- Enter the entity ID and click【Next】 ( Figure 3-10 ) .
- Lowpass_v5 Enter the sample information and click when you are done 【Next】 ( Figure 3-11 ) :

Lowpass\_v5 Description of the analysis variables
SN:Sample name or special ID,default is consistent with the Entity ID;
LIB:BWA DNA preparation library identifier input, or customize ( e.g., SN ) ;
PU:BWA platform unit info input such as slide-id+lane, or customize ( e.g., SN ) ;
RefPanel:The reference panel only consists of 'hg38' ( GRCh38 ) ;
RawFastqs:Sequencing raw data ( fq.gz ) . PE: one pair of FASTQ files in one file group(Note the FASTQ file selection order), SE:one FASTQ files in one file group;
DoCNVStep:Calling CNV ( Copy Number Variation ) ;
DoPRSStep:To PRS ( Polygenic Risk Score ) analysis, only human;
- Click 【Run】 start the analysis ( Figure 3-12 ) :

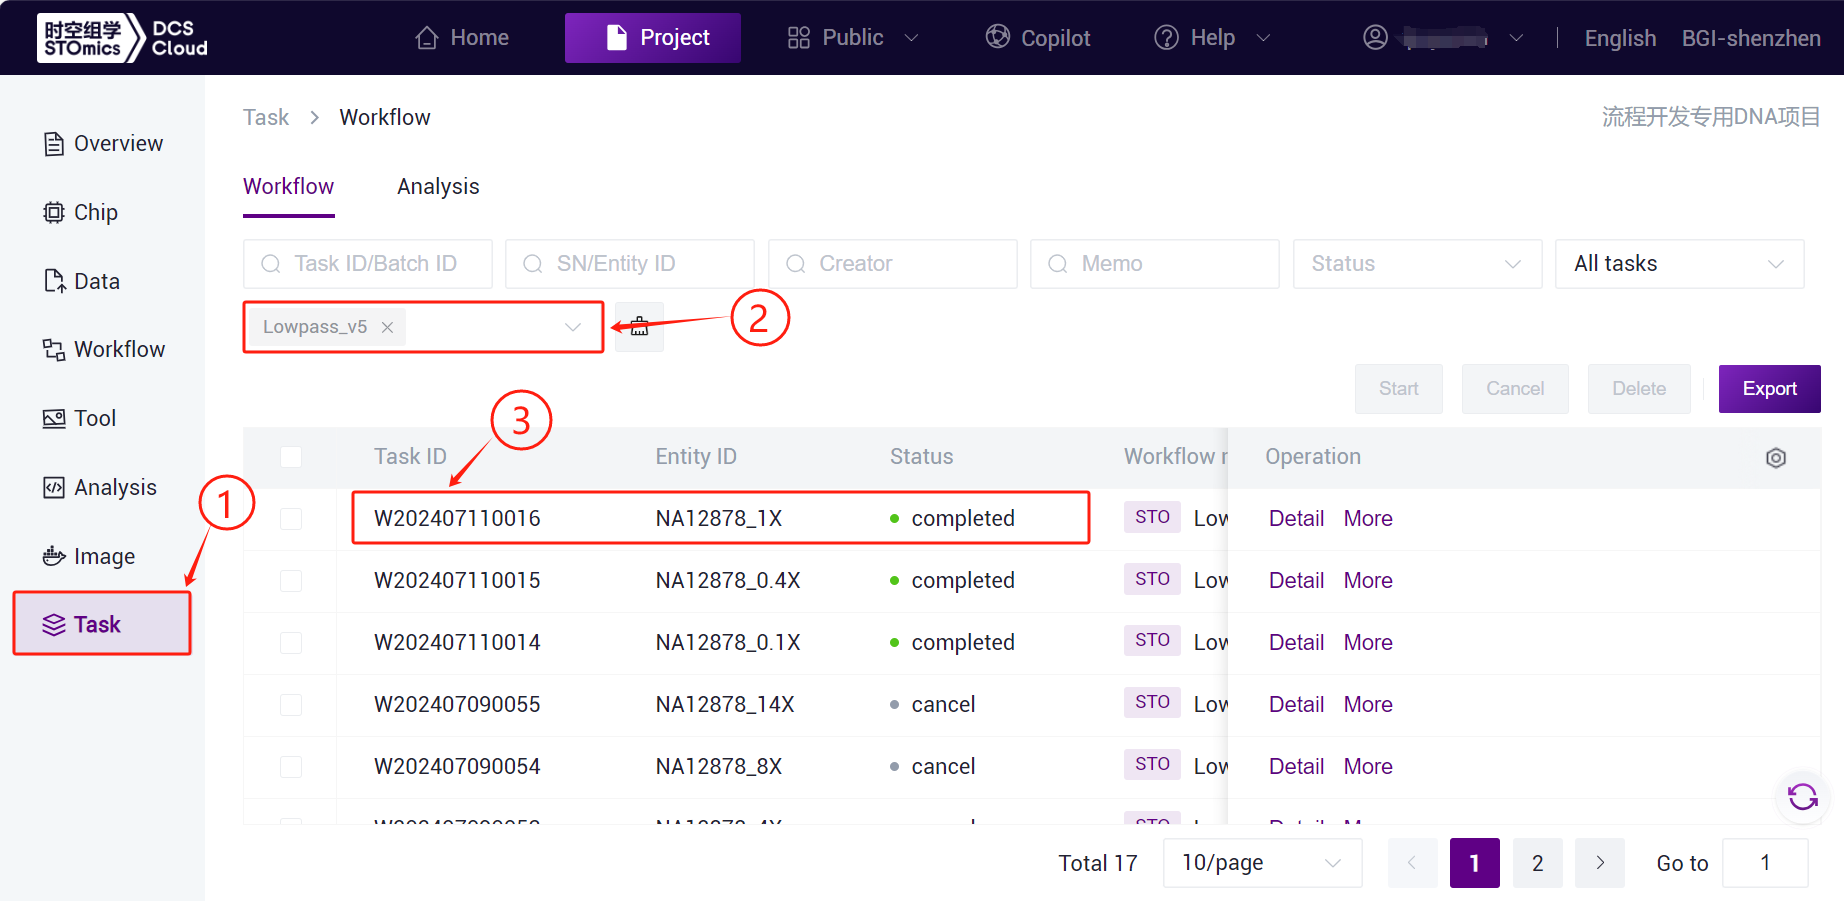
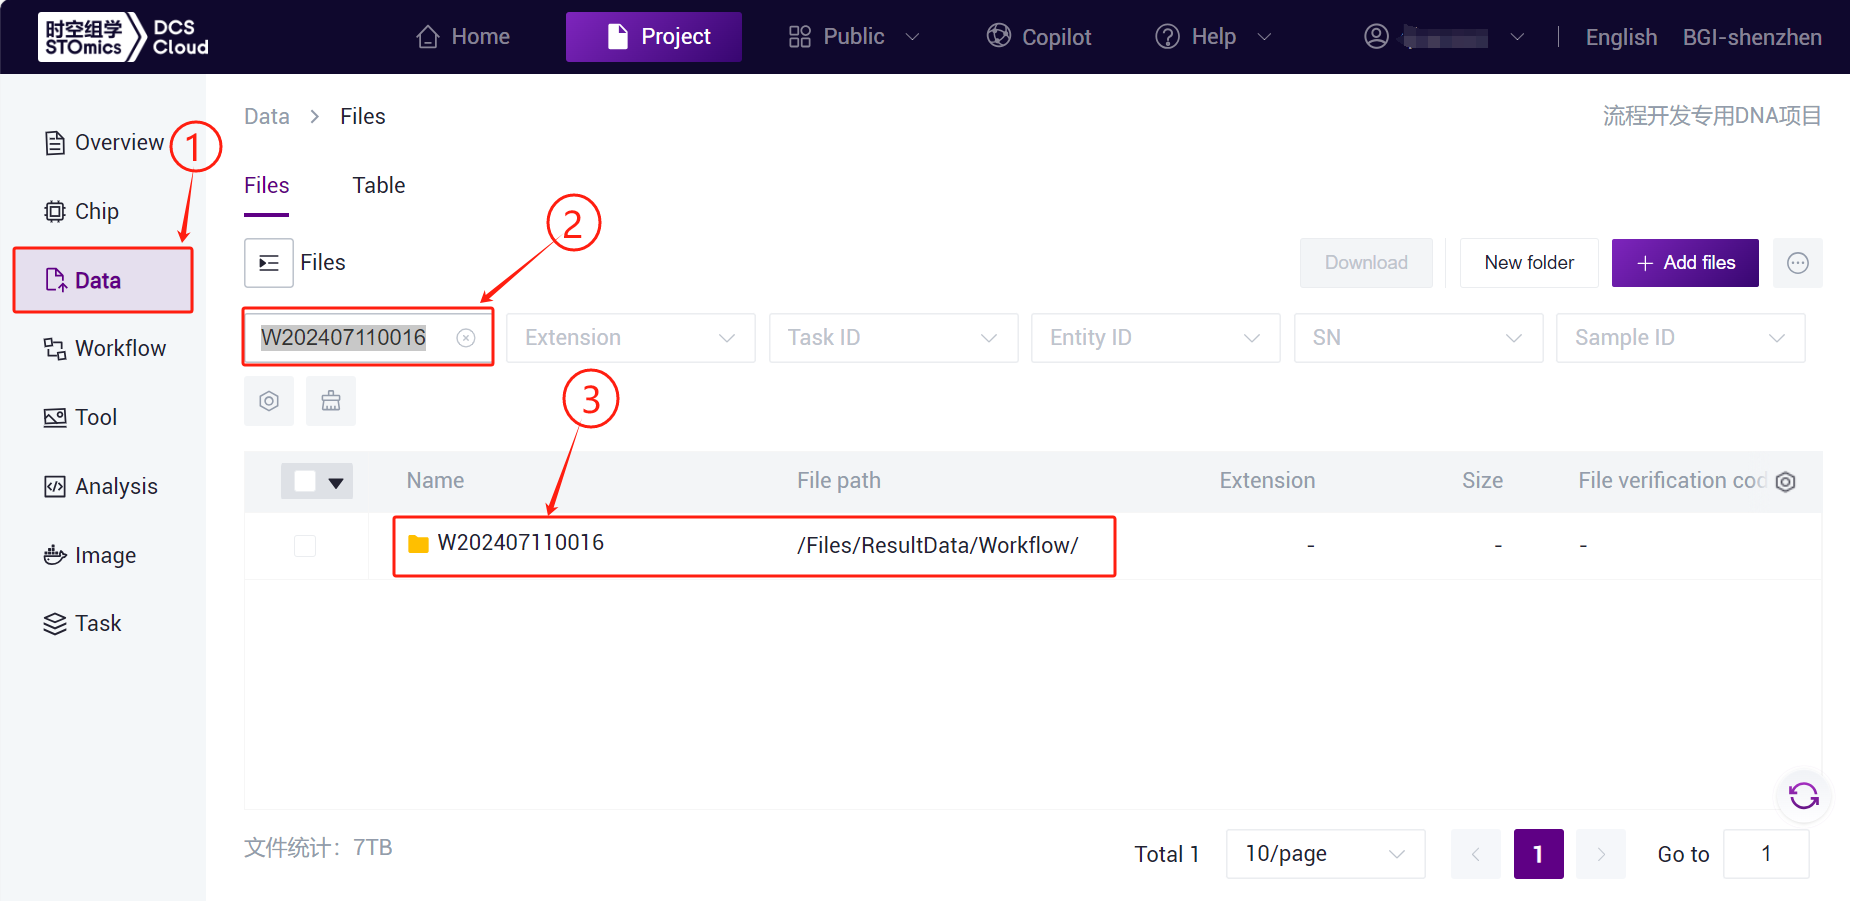
- Click the left-hand navigation bar【Task】 enter the process analysis page , select Lowpass_v5 in the Workflow name, to view the task status, and after the task is complete, the task status is displayedcompleted , copy Task ID ( Figure 3-13 ) , click the navigation bar【Data】,enter the Task ID into Folder/File to search , the W202407110016 folder will be used as input to the DataDir parameter of LowpassSummaryV5( Figure 3-14 ) .
3.2.4 Step 4: Output the report from LowpassSummary
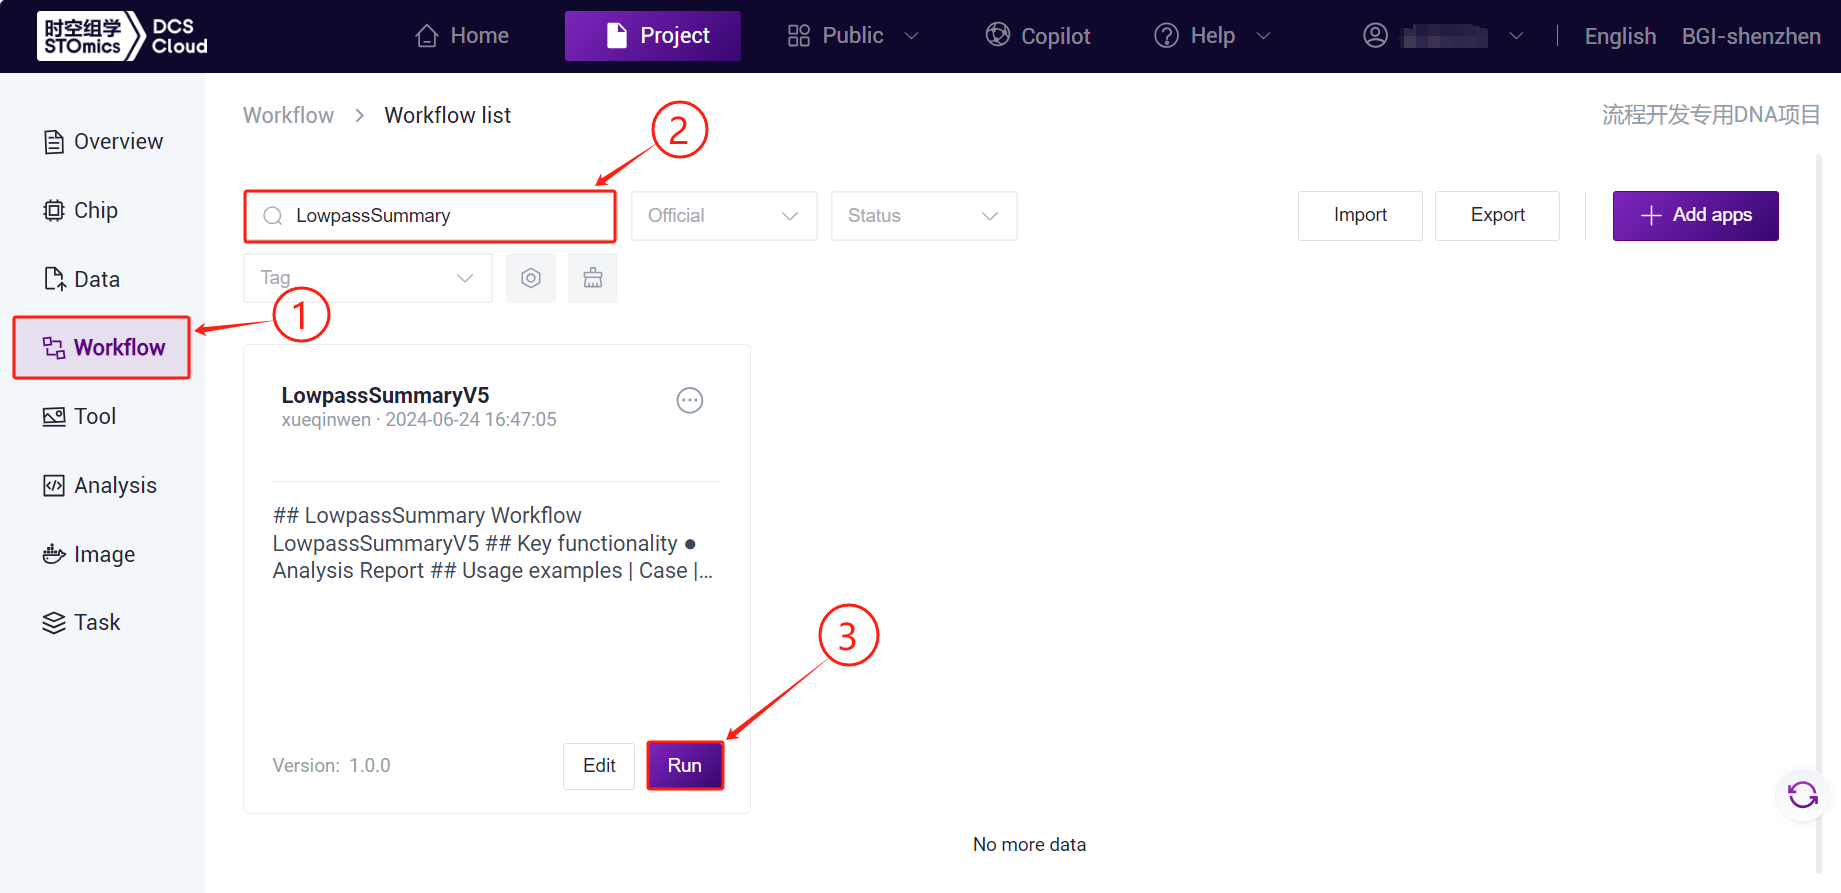
- Click the left-hand navigation bar【Workflow】 go to the Process Analysis page and enter LowpassSummary in the search box , click 【Run】 ( Figure 3-15 ) :
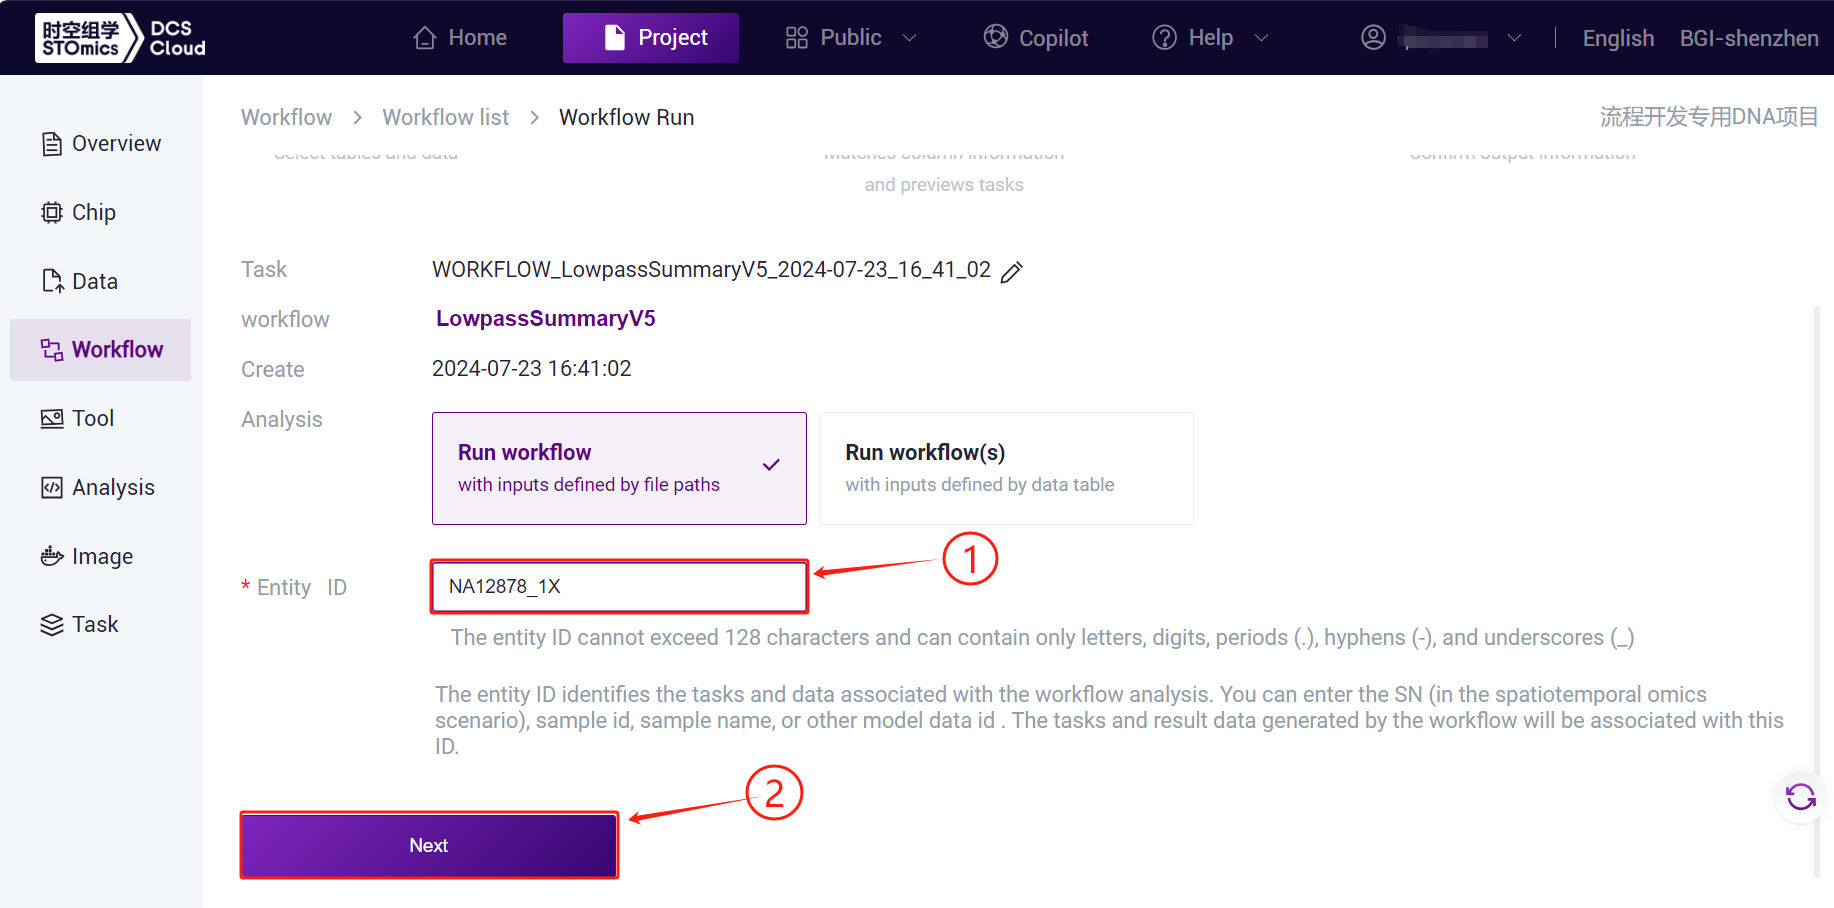
- Enter the entity ID and click【Next】 ( Figure 3-16 ) :
- LowpassSummaryV5 Enter the sample information , click when you're done 【Next】 ( Figure 3-17 ) :
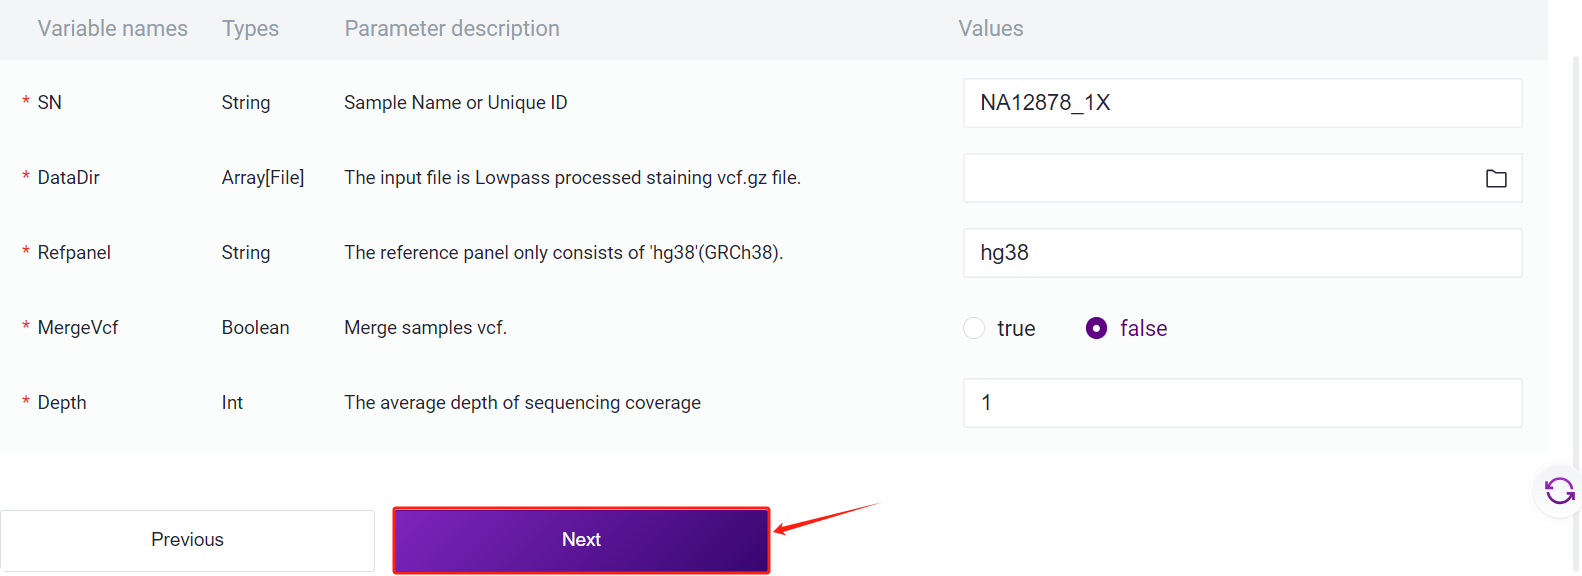
LowpassSummaryV5 description of the variable
SN:Sample name or special ID,default is consistent with the Entity ID;
DataDir:The input file is Lowpass processed staining vcf.gz file.(That is , the output folder of the Lowpass analysis , such as the folder generated in Step 3 ( 3.2.3LowpassAnalysis ) ,W202407110016) ;
RefPanel:The reference panel only consists of 'hg38' ( GRCh38 ) ;
MergeVcf:Merge samples vcf ;
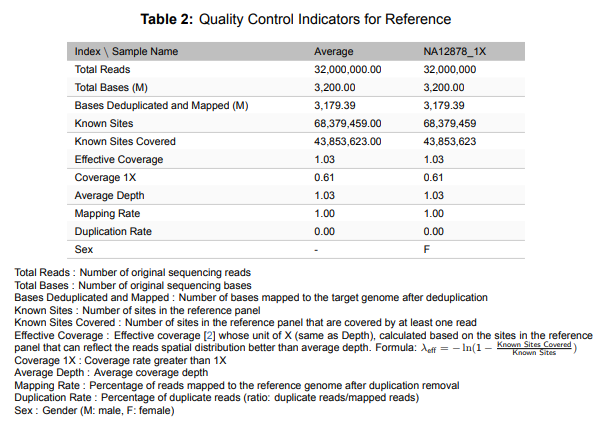
Depth:The average depth of sequencing coverage ;
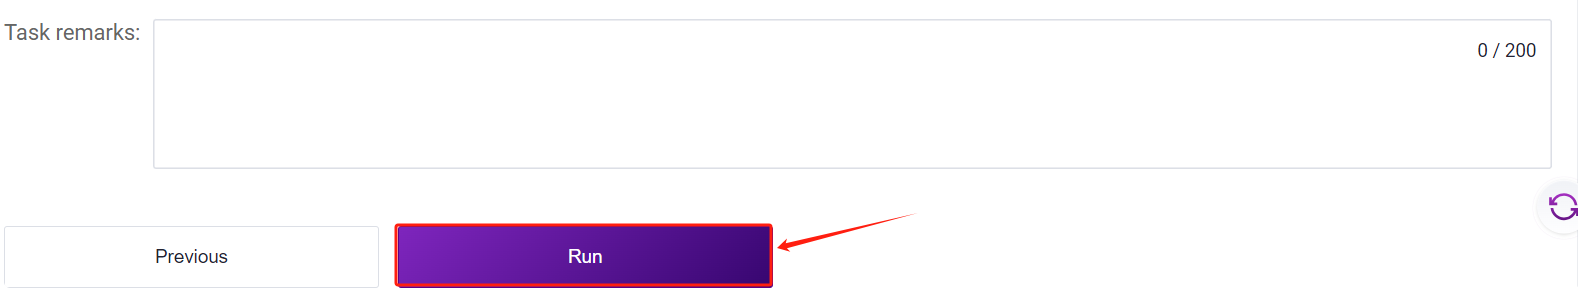
- Click【Run】 start the analysis ( Figure 3-17 ) :
3.3 Scenario 2: Form delivery
There are five steps: upload data, add a workflow, download the form template, fill out and import the form, and start the analysis. After the sample template is imported, you can run the tasks in batches when the customer sees that the task status iscompleted , it means that the task has been completed , and you can view the report section ( see section 3.4 for details).
3.3.1 Step 1: Upload data
This is the same as step 1 of scenario 1 (manual delivery). ( For details , see 3.2.1 Step 1 :Upload Data in Step 1 ) .
3.3.2 Step 2: Add a workflow
This is the same as step 2 of Scenario 1 (manual delivery). ( For details , see 3.2.2 Step 2 :Add a workflow in Step 2 ) .
3.2.3 Step 3: Download the form template
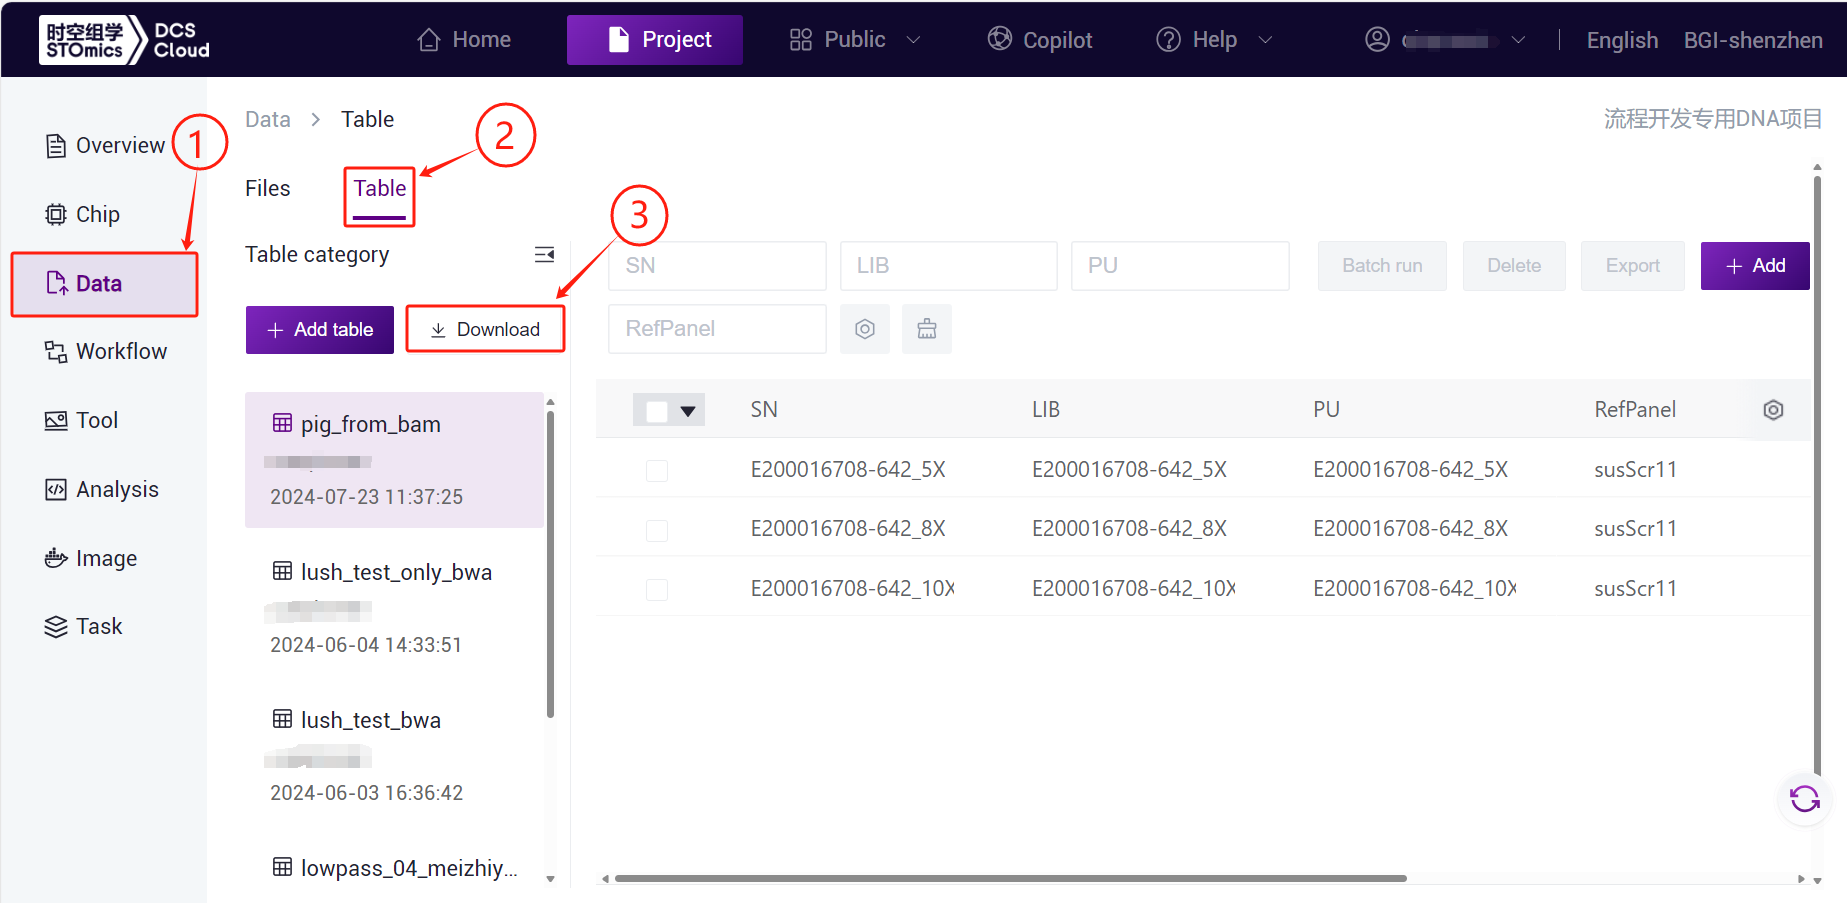
- Click the left-hand navigation bar 【Data】 , select 【Table 】 - 【 Download】 ( As shown in Figure 3-18 ) , click 【Workflow template】 , select Lowpass_v5、LowpassSummaryV5 template to download :
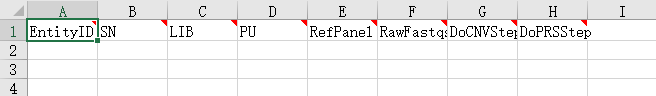
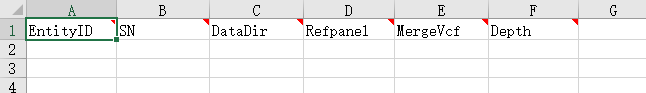
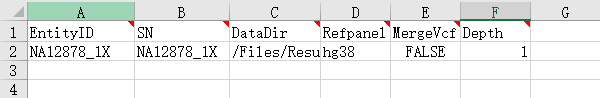
- Open the sample template Excel as shown in Figure 3-19 and Figure 3-20:
3.3.4 Step 4: Fill in and import the form
- In this scenario, you need to fill in a worksheet to import the form. In this scenario, the sequencing sample data is imported into the table and then directly analyzed .
Tips
Excel Precautions :
[1] The path of the import file must already exist on the cloud platform .
[2] In the template, all fields are mandatory, and no fields must be empty .
[4] Cells cannot be merged in Excel, and there can be no spaces or special characters before and after the cell content .
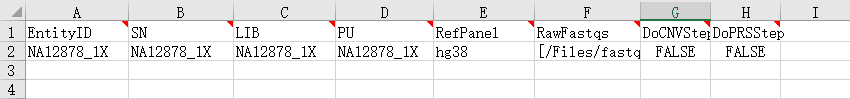
[5] Sample entry for analysis ( Figure 3-21 , Figure 3-22 ) :
Lowpass\_v5 description of the variable
Entity ID:You can enter SN ( spatiotemporal omics ) , sample id, sample name, or other real data IDs required for analysis, and the tasks and result data generated by the process will be associated with this ID ;
SN:Sample name or special ID,default is consistent with the Entity ID;
LIB:BWA DNA preparation library identifier input, or customize ( e.g., SN ) ;
PU:BWA platform unit info input such as slide-id+lane, or customize ( e.g., SN ) ;
RefPanel:The reference panel only consists of 'hg38' ( GRCh38 ) ;
RawFastqs:Sequencing raw data ( fq.gz ) . PE: one pair of FASTQ files in one file group(Note the FASTQ file selection order), SE:one FASTQ files in one file group;
DoCNVStep:Calling CNV ( Copy Number Variation ) ;
DoPRSStep:To PRS ( Polygenic Risk Score ) analysis, only human;
LowpassSummaryV5 description of the variable
Entity ID:You can enter SN ( spatiotemporal omics ) , sample id, sample name, or other real data IDs required for analysis, and the tasks and result data generated by the process will be associated with this ID ;
SN:Sample name or special ID,default is consistent with the Entity ID;
DataDir:The input file is Lowpass processed staining vcf.gz file.(That is , the output folder of the Lowpass analysis , such as the folder generated in Step 3 ( 3.2.3LowpassAnalysis ) ,W202407110016) ;
RefPanel:The reference panel only consists of 'hg38' ( GRCh38 ) ;
MergeVcf:Merge samples vcf ;
Depth:The average depth of sequencing coverage ;
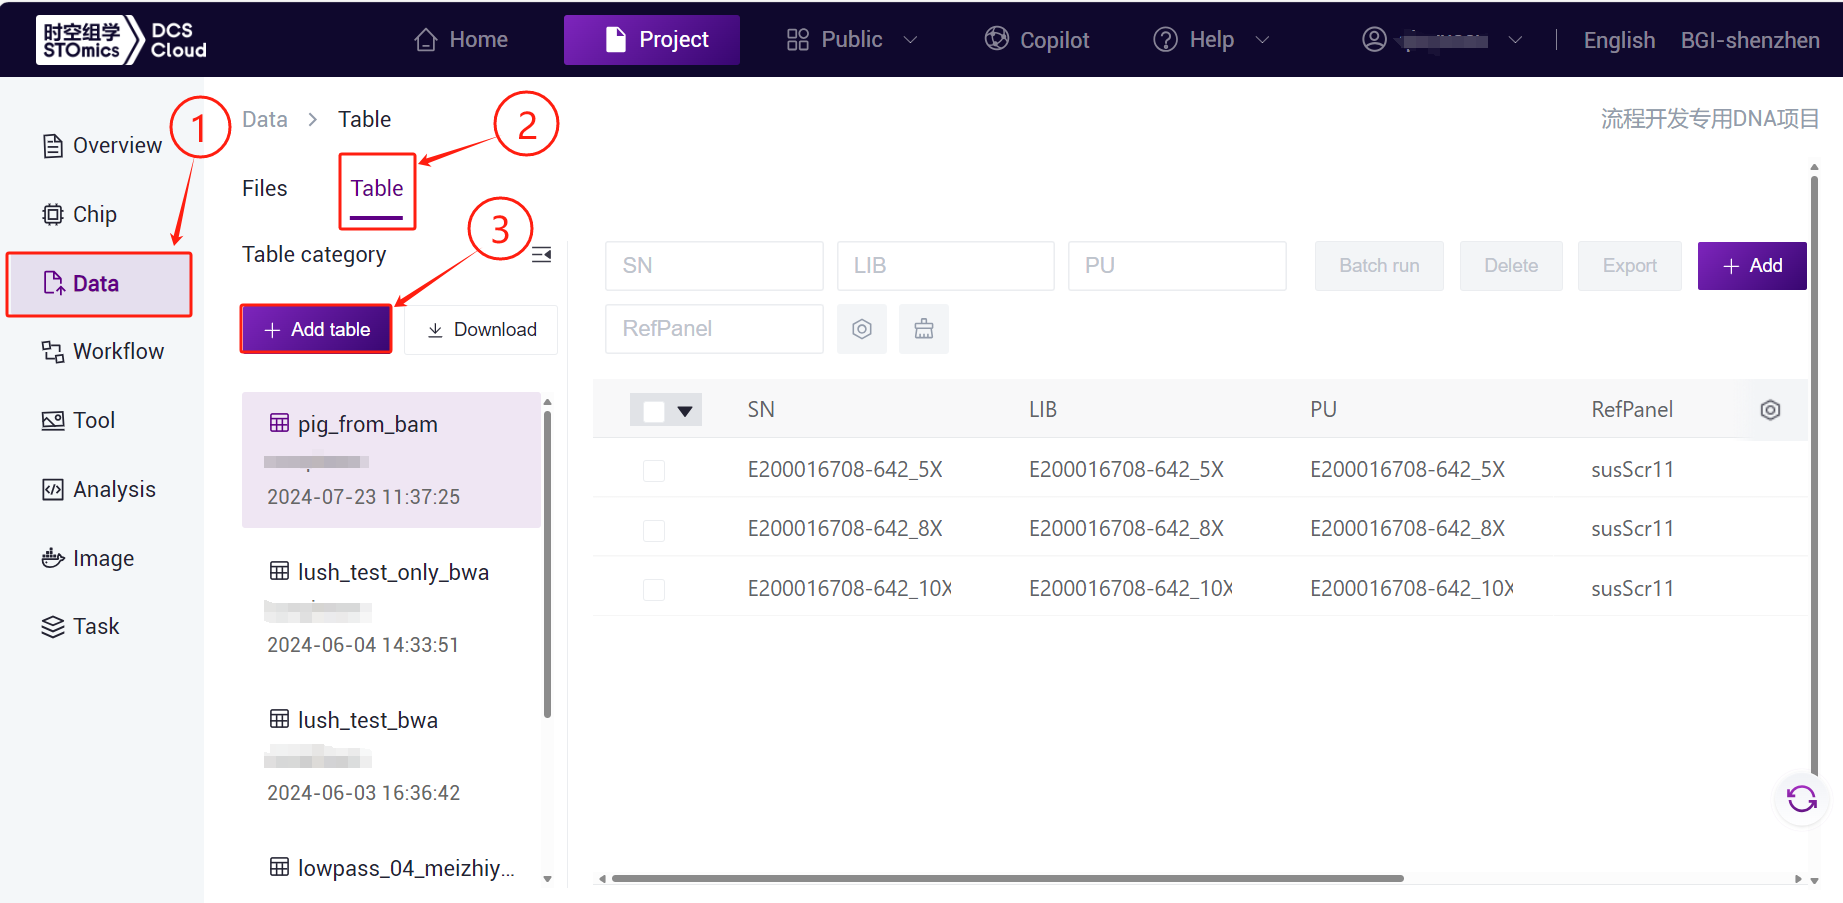
After the table template is configured, return to the 【**Data**】 page,click 【**Table 】 - 【 + Add table**】 ( Figure 3-23 ) :
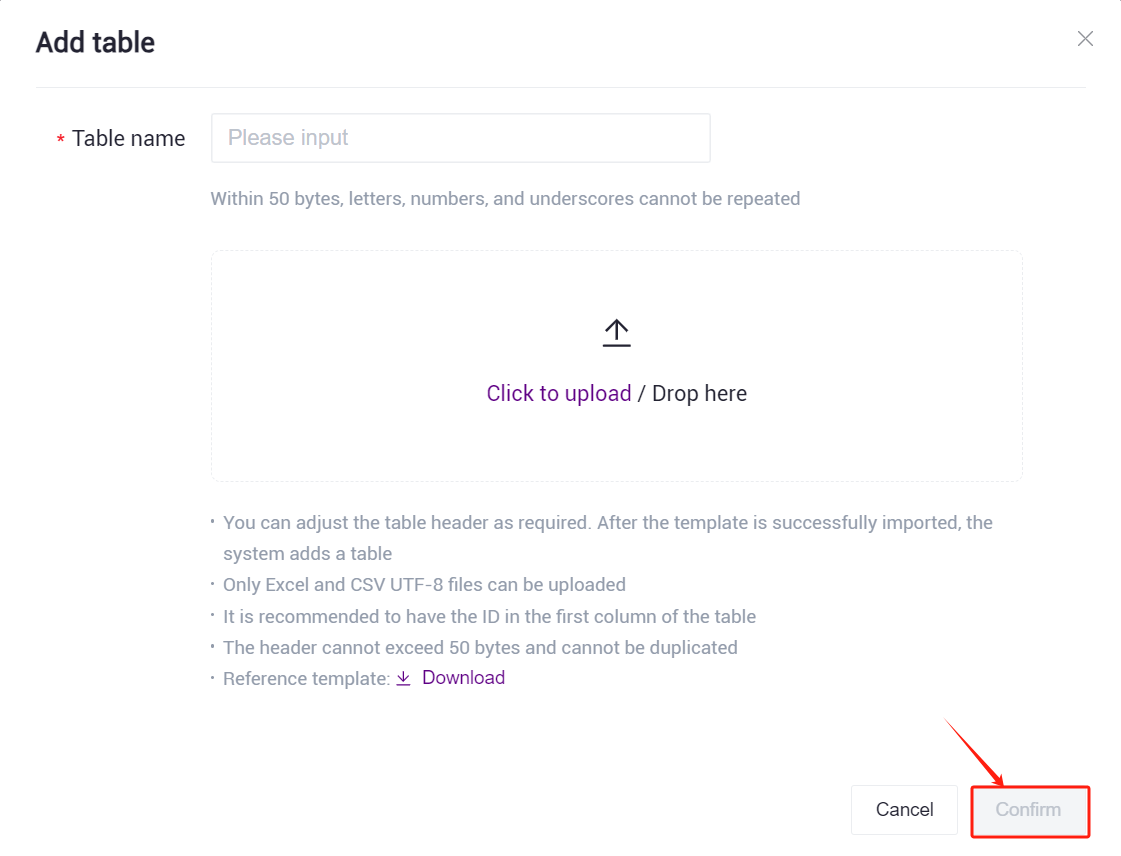
- Click【Click to upload / Drop here】 browse and select the form with the sample information already filled , click 【Confirm】 ( Figure 3-24 ) , once the upload is complete, the file will appear in the destination folder :
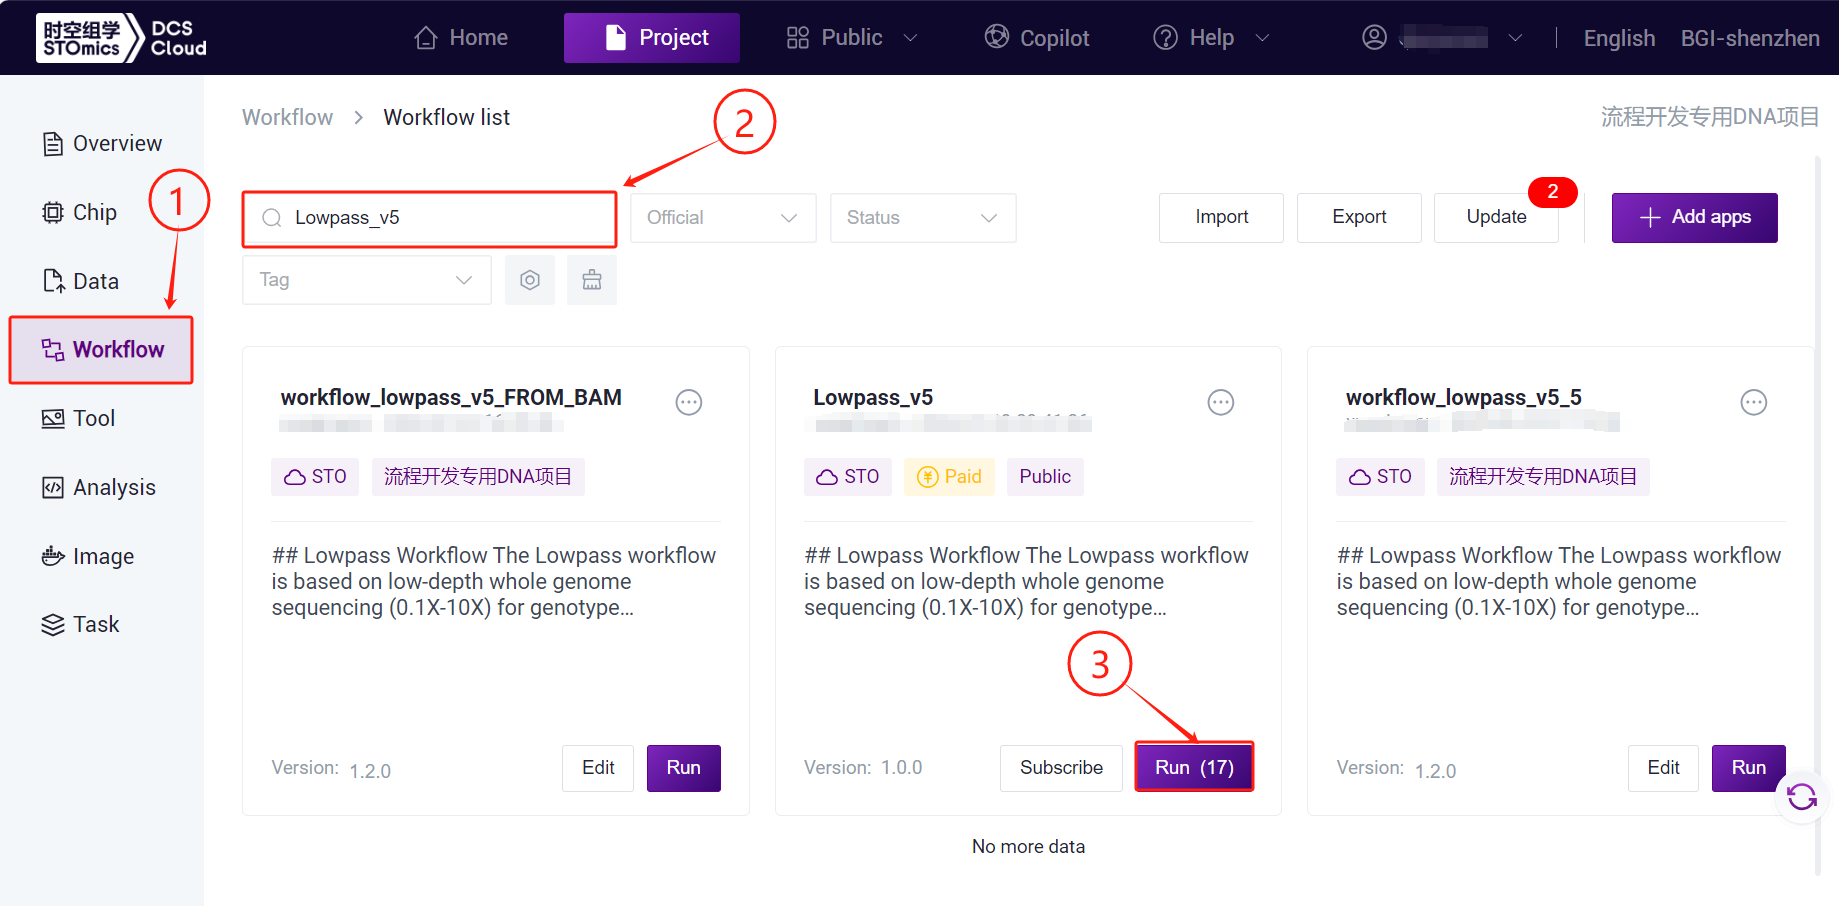
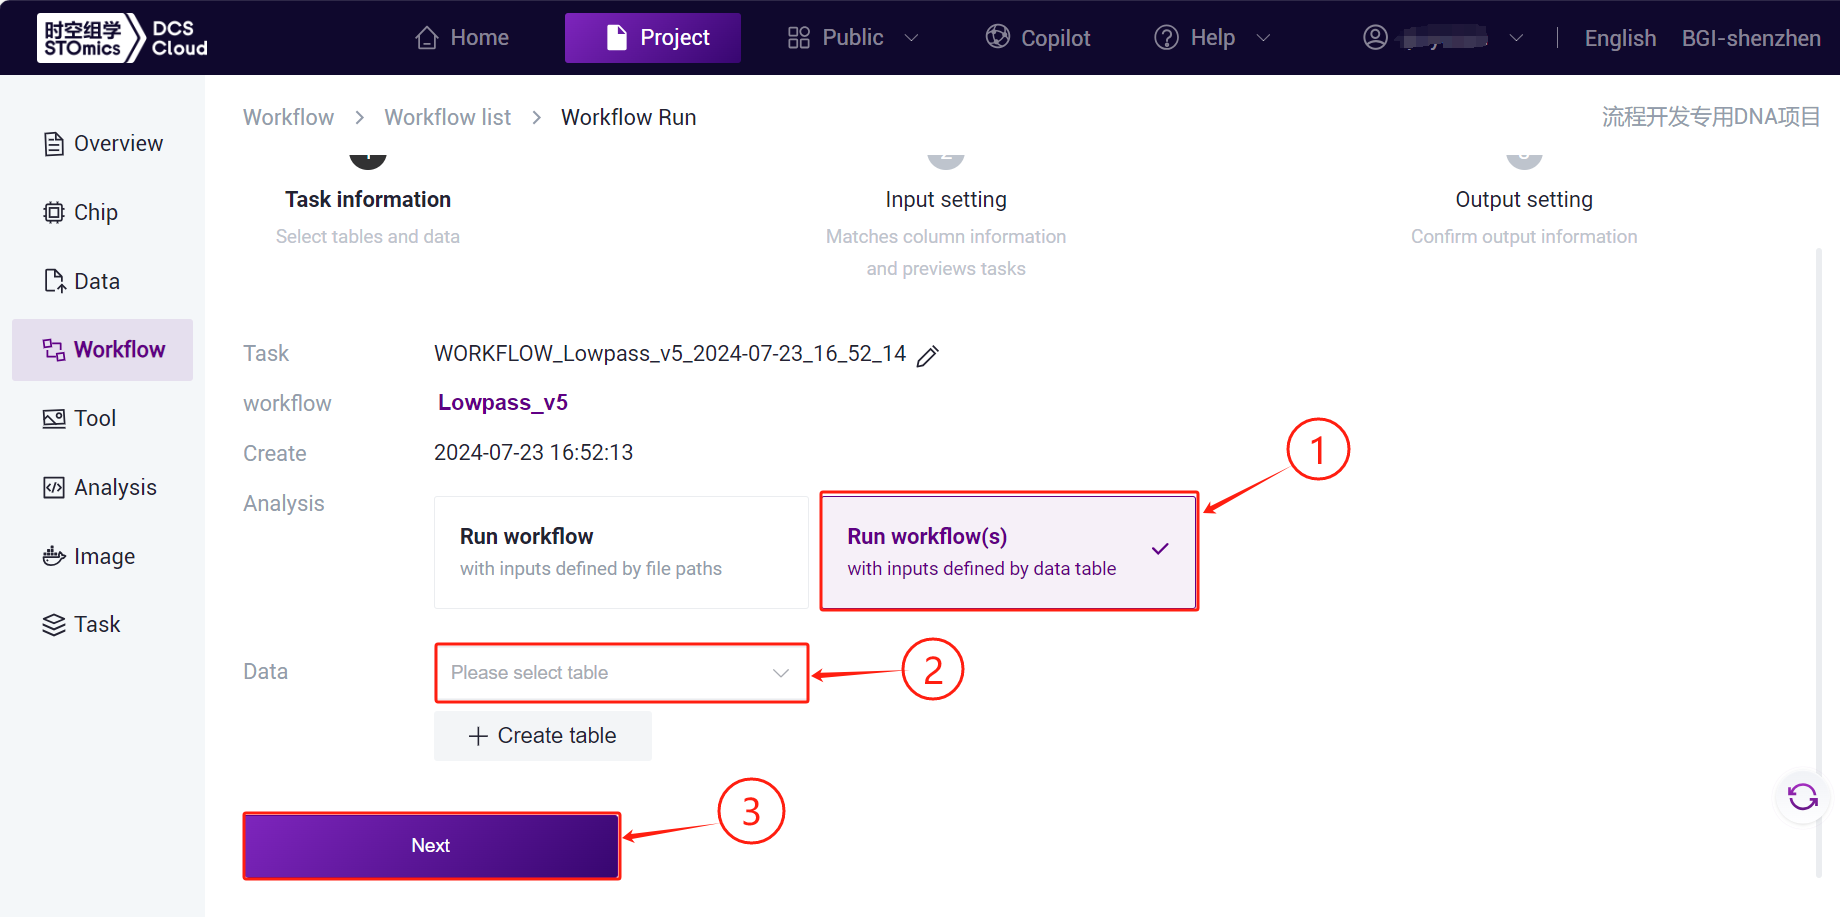
Click the navigation bar【**Workflow**】 go to the Process Analysis page and enter**Lowpass\_v5**or**LowpassSummaryV5**in the search box , click 【**Run**】 ( Figure 3-25 ) :
Here we take Lowpass_v5 as an example
Seclect**the right Analysis ( input defined by data table )**, click “Please select the form” section , select the table imported in this subsection 3) and select the desired rows , click 【**Next**】 ( Figure 3-26 ) :
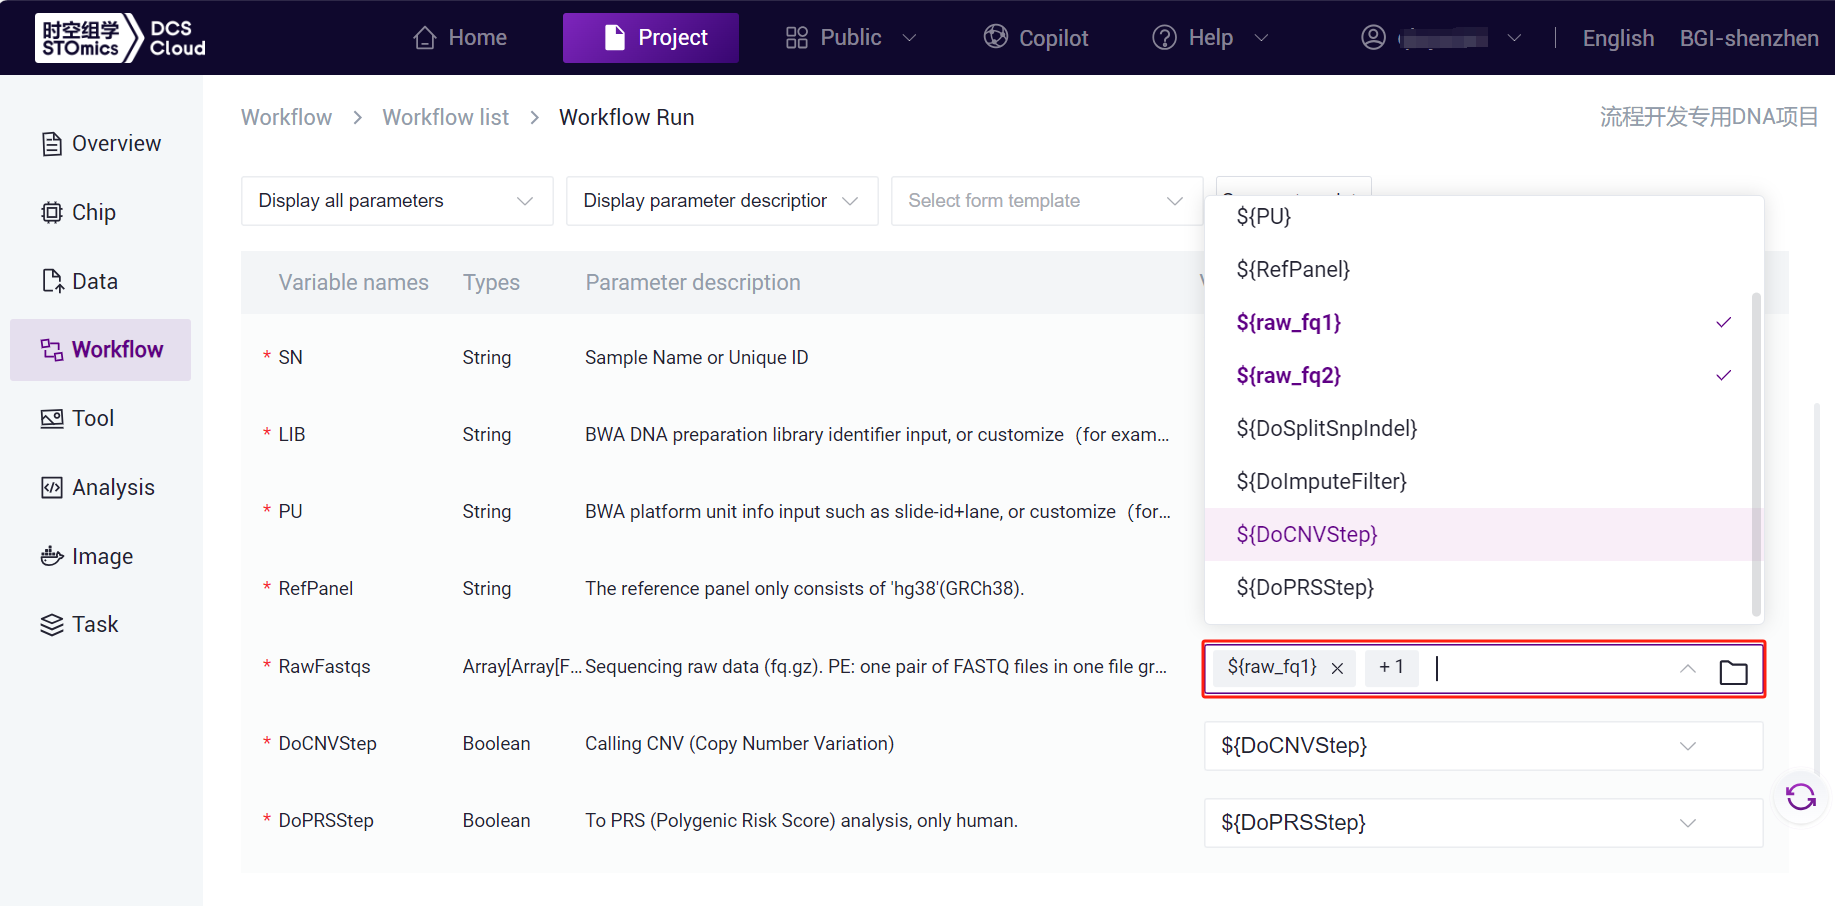
- Click in the Value“ ” and select the corresponding value , for example, if RawFastqs selects ${raw_fq1} and ${raw_fq2}, note that ${raw_fq1} and ${raw_fq2} should be selected in order ( as shown in Figure 3-27 ) .
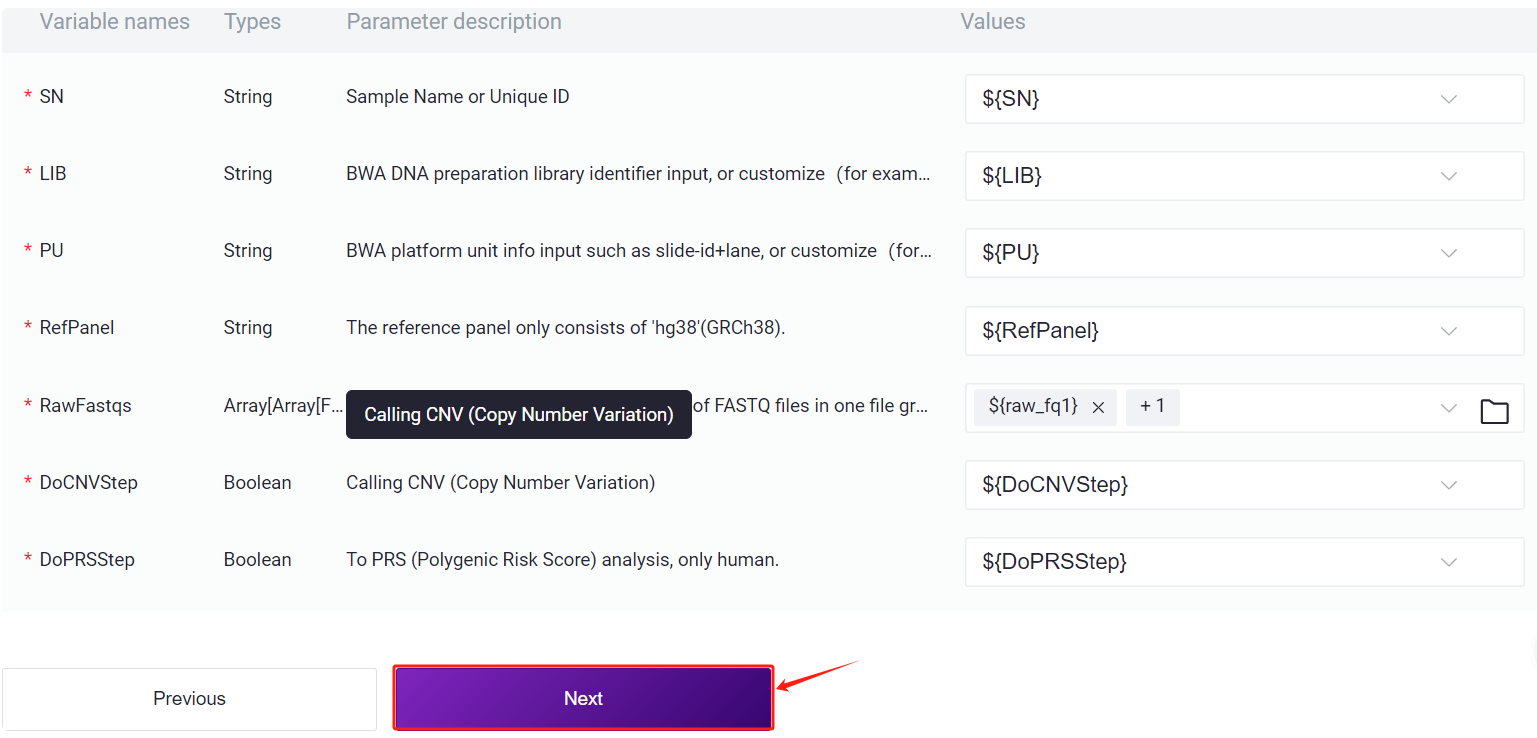
- Enter the sample information and click【Next】 when you are done , Make sure that the parameters are set correctly ( as shown in Figure 3-28 ) :
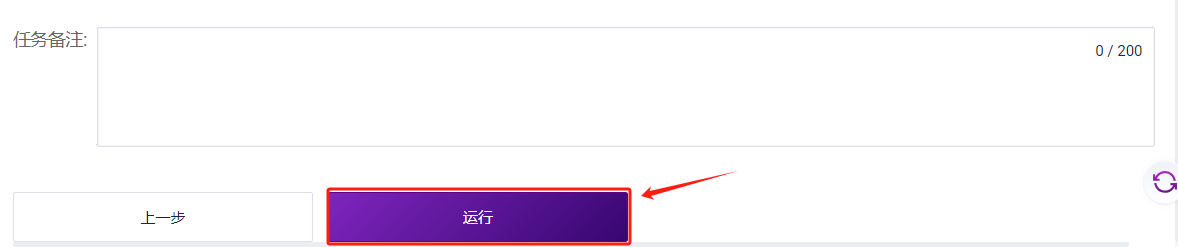
3.3.5 Step 5: Start the analysis
Click 【Run】 start to analysis ( Figure 3-29 )
3.4 Report viewing and result file download
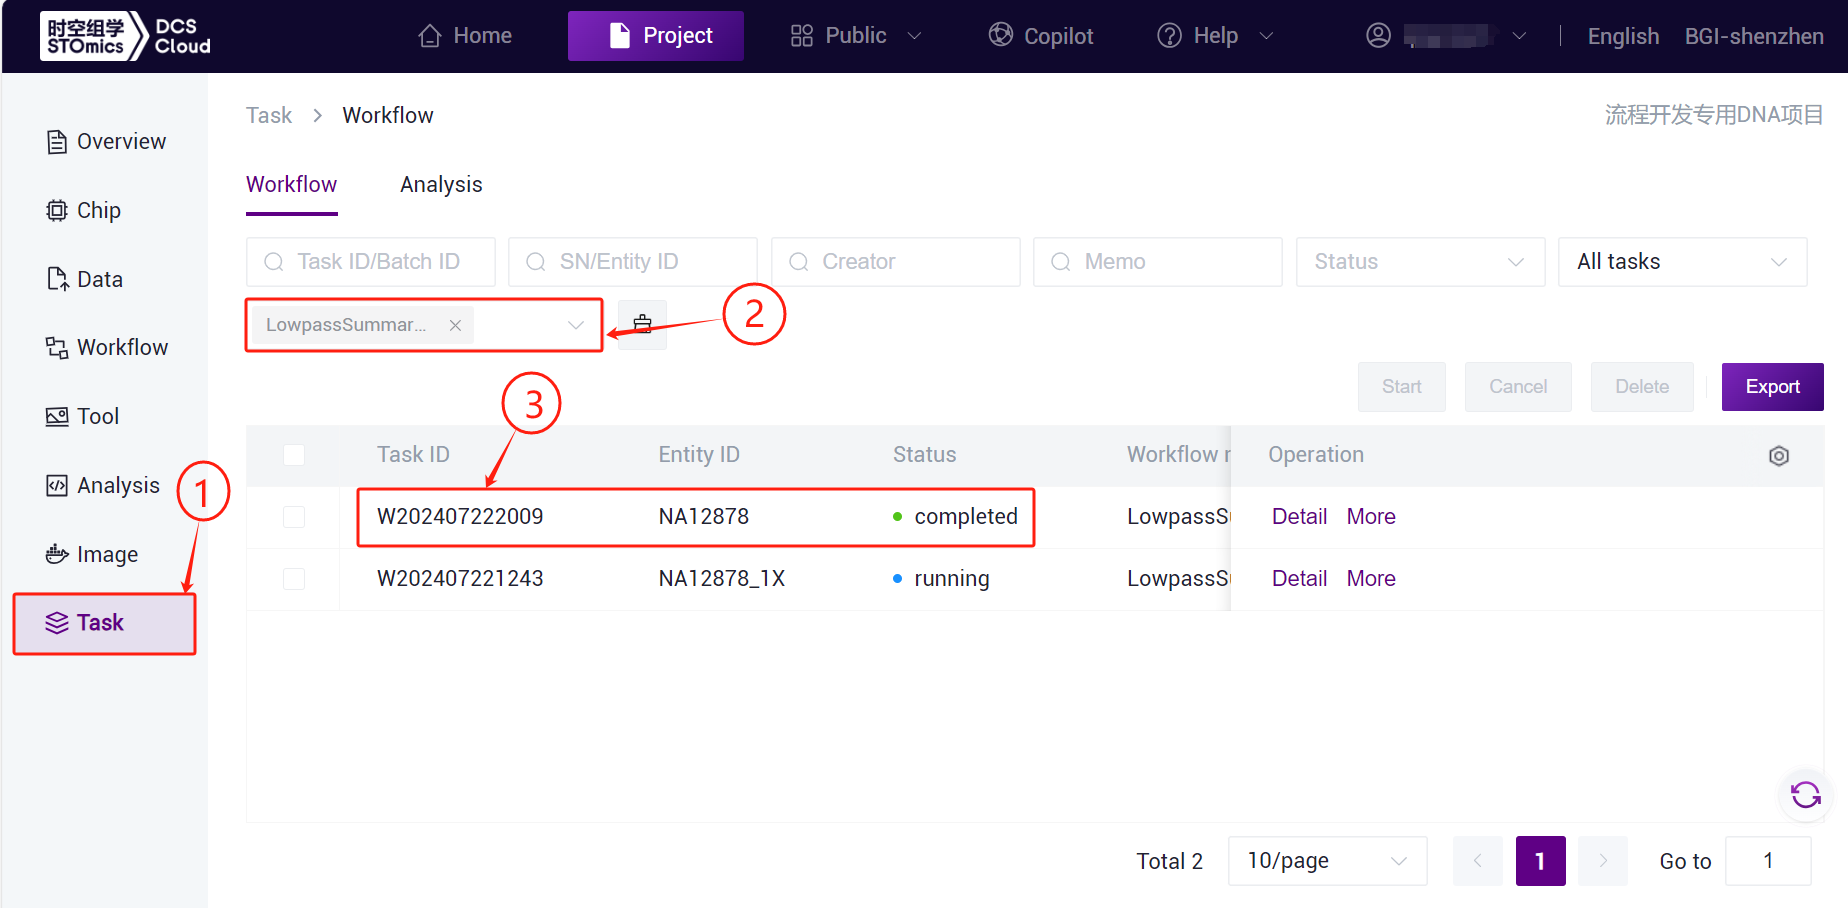
- Click the left-hand navigation bar【Task】 go to the Task Management page , select LowpassSummaryV5 in Workflow name, view the task status, and after the task is completed, the task status is displayedcompleted , it means the task is completed , you can view the report section and copy the Task ID( Figure 3-30 ) :
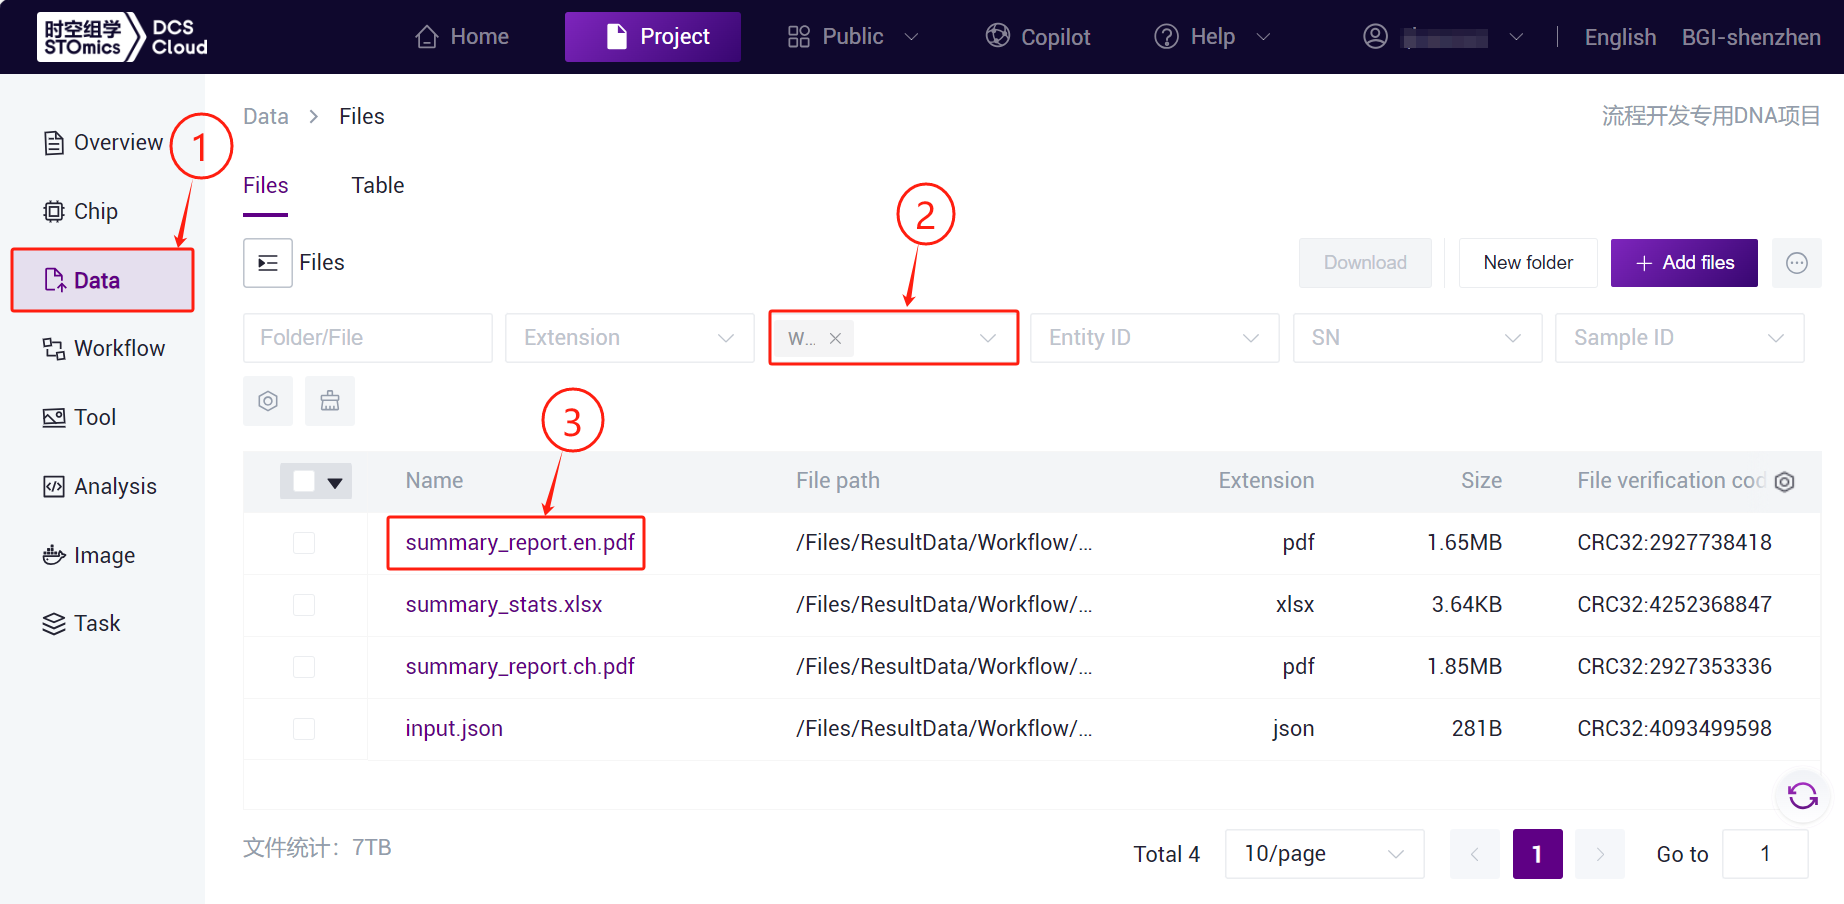
- Click the navigation bar【Data】 , enter the Task ID to search , click the Name of the file , to view the file directly ( Figure 3-31 ) :
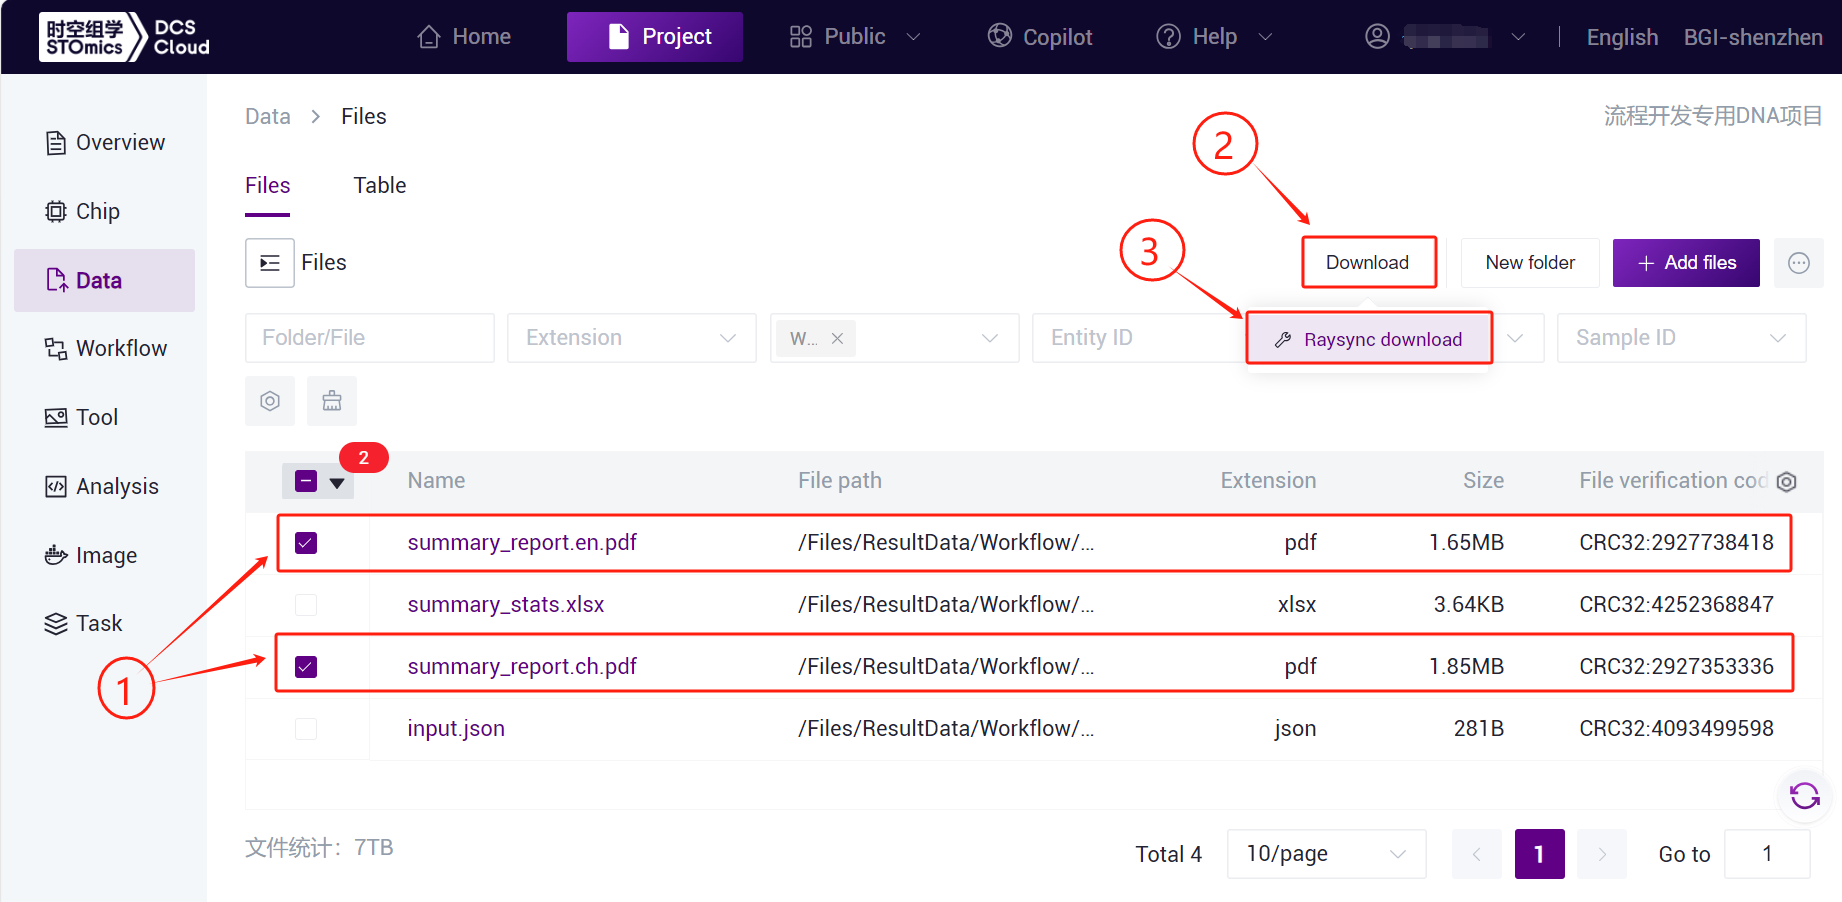
- Selected summary_report.en.pdf and summary_report.ch.pdf file , click 【Download 】 - 【 Raysync download】 ( As shown in Figure 3-32 ) :
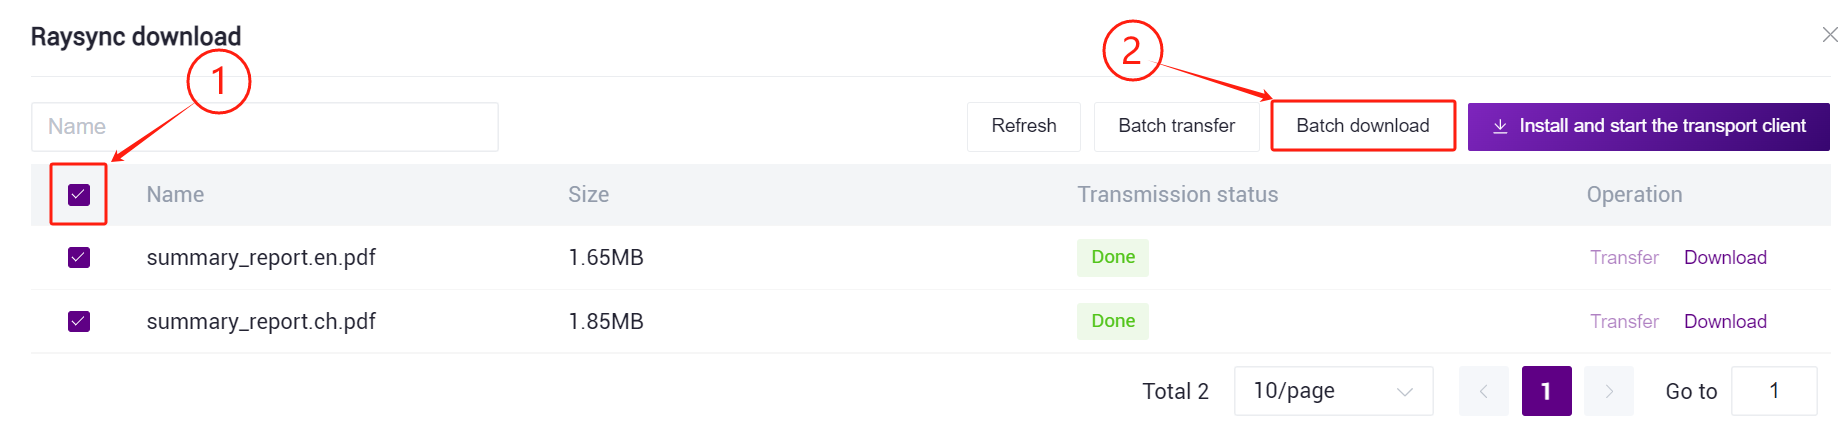
- Selected all the files , click【Batch download】 ( as shown in Figure 3-33 ) , then select the storage path to complete the download , if it is the first time to download ,Raysync tools need to be installed , click 【Install and start the transport client】 :
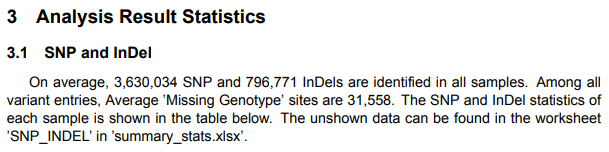
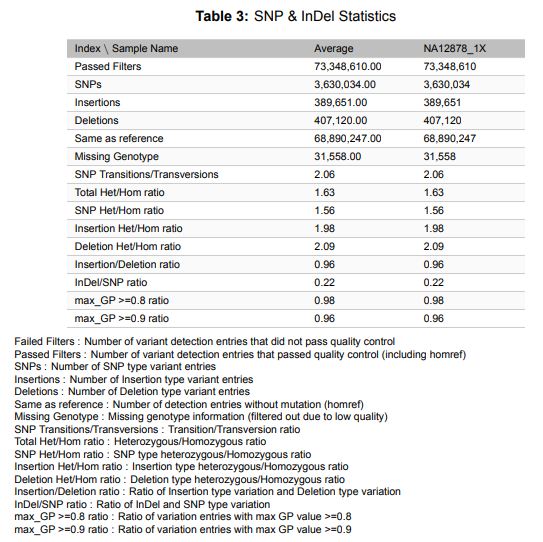
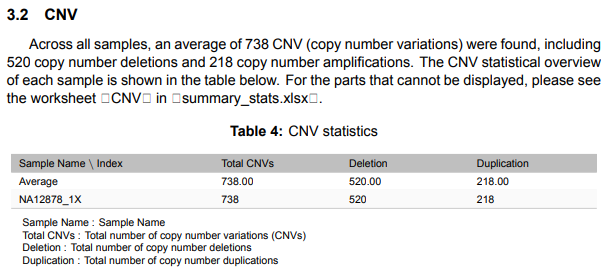
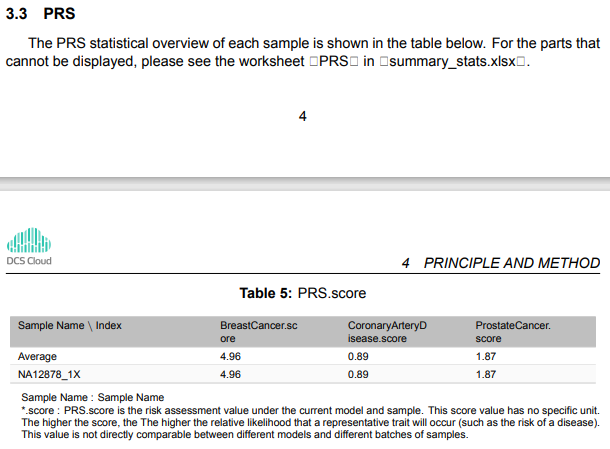
4. Chapter 4 Presentation of Results
4.1 Lowpass sample analysis report display