StereoMiner
StereoMiner
StereoMiner (advanced analysis):Advanced analytics for spatial transcriptome can be conducted on the DCS Cloud platform after completing the standard SAW analysis. it can proceed to the advanced analysis with zero lines of code. Various parameters can be flexibly configured, and the analysis results are presented intuitively. The entire process can be submit with just one click. The main process includes data preprocessing, clustering, annotation, pseudotime, cell‑cell interaction analysis, functional enrichment analysis, and finally generates an advanced analysis report, completing the delivery of spatial transcriptome analysis.
singlecellMiner (advanced analysis):are similar to StereoMiner (Advance Analysis), including data preprocessing, cluster/annotation, Pseudotime analysis, interaction analysis, and functional enrichment analysis. No report generation module is available.
Analysis entry
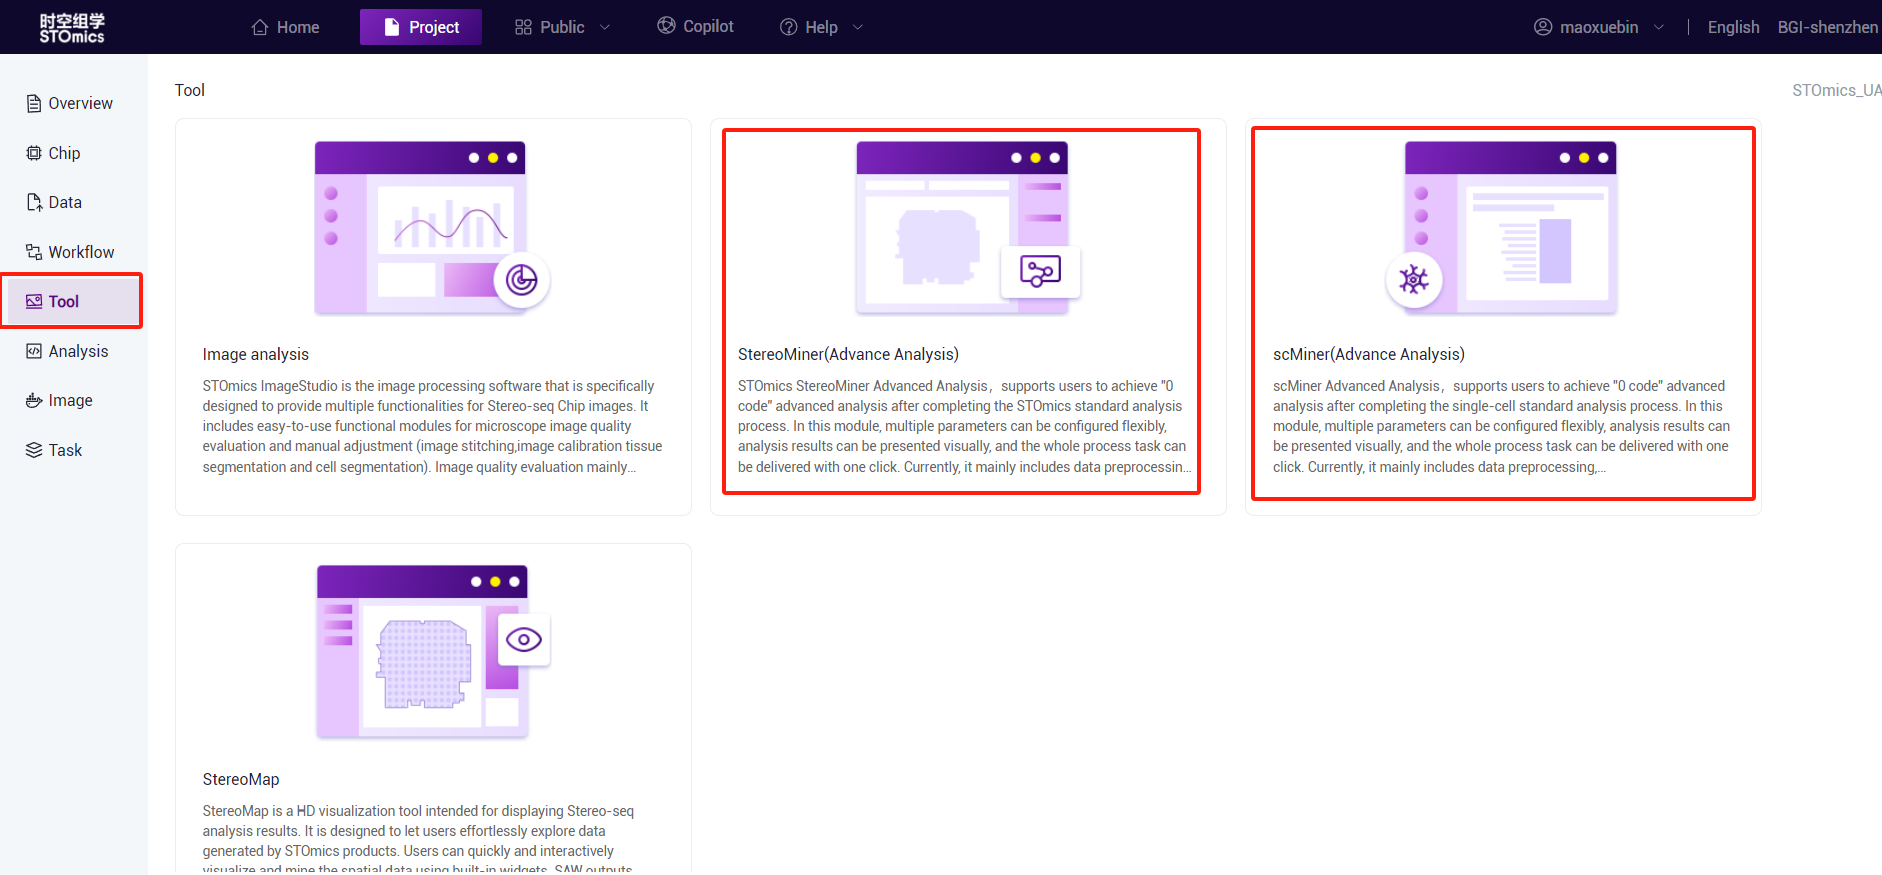
- Tool entry
By clicking Tool‑StereoMiner (Advance Analysis) or scMiner (Advance Analysis) to enter according to your requirement.
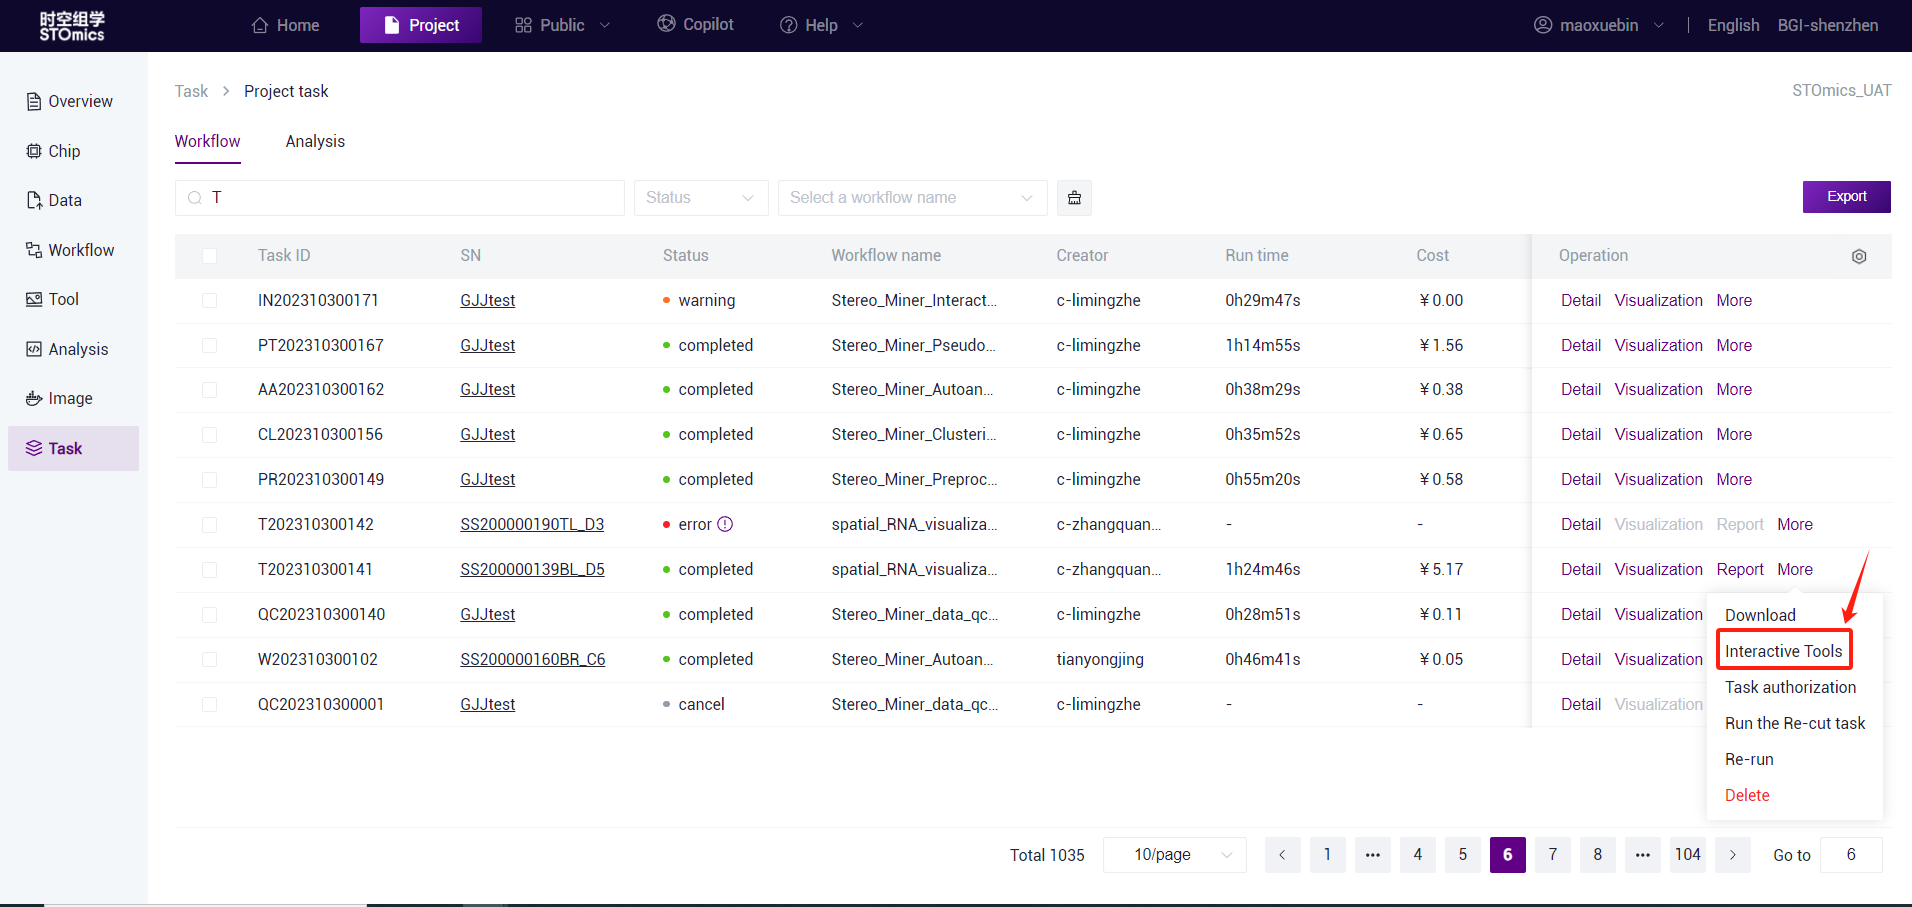
- Task entry (only stereo‑seq is supported)
On the DCS Cloud Task list page, each completed SAW standard analysis task provides the Advanced analysis entry, you can click the Advanced Analysis button to enter the analysis.
Select file
1.StereoMiner (Advance Analysis)
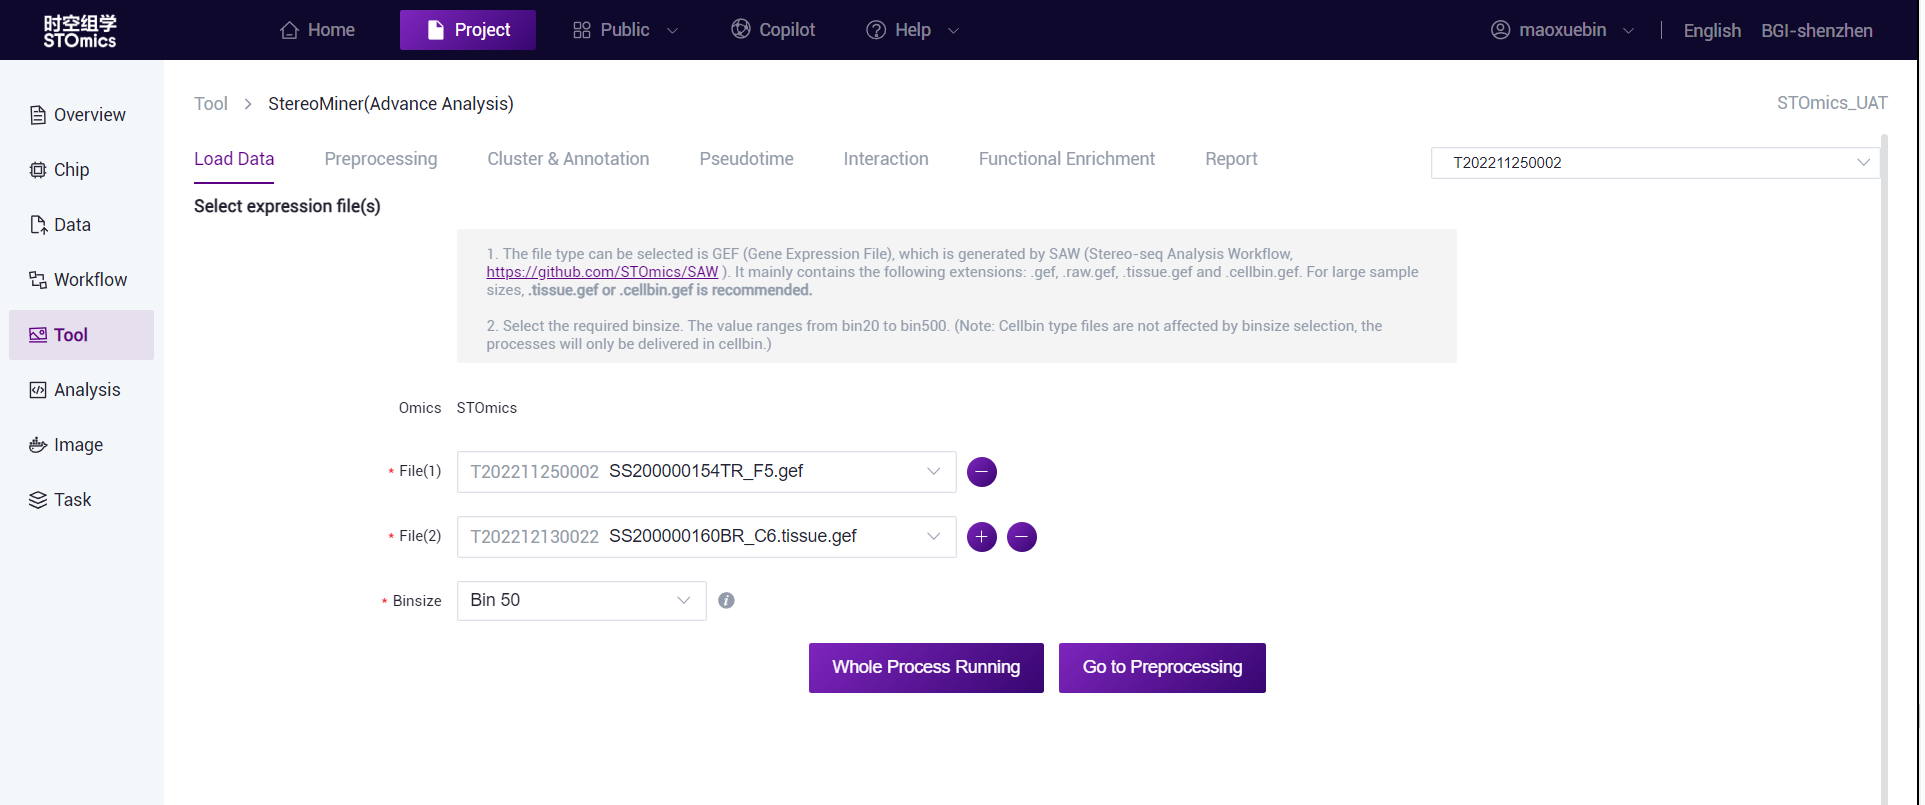
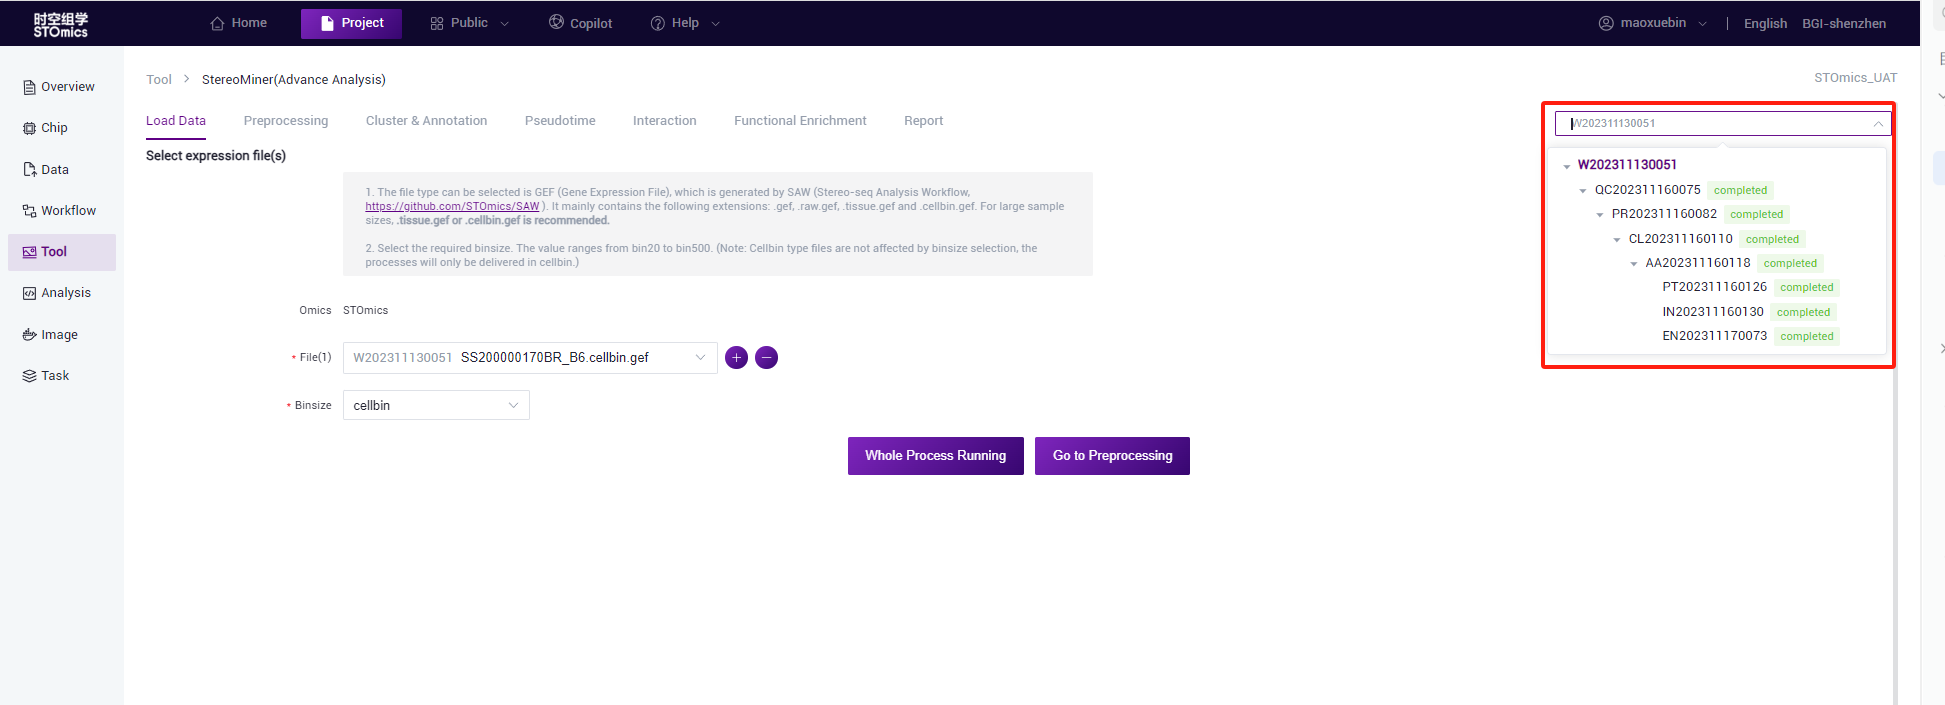
- Click on the "Select" button to enter the Data management window and select the expression matrix files of gef format. You can select an existing gef file in the project or upload one gef file to Data management and select the gef file.
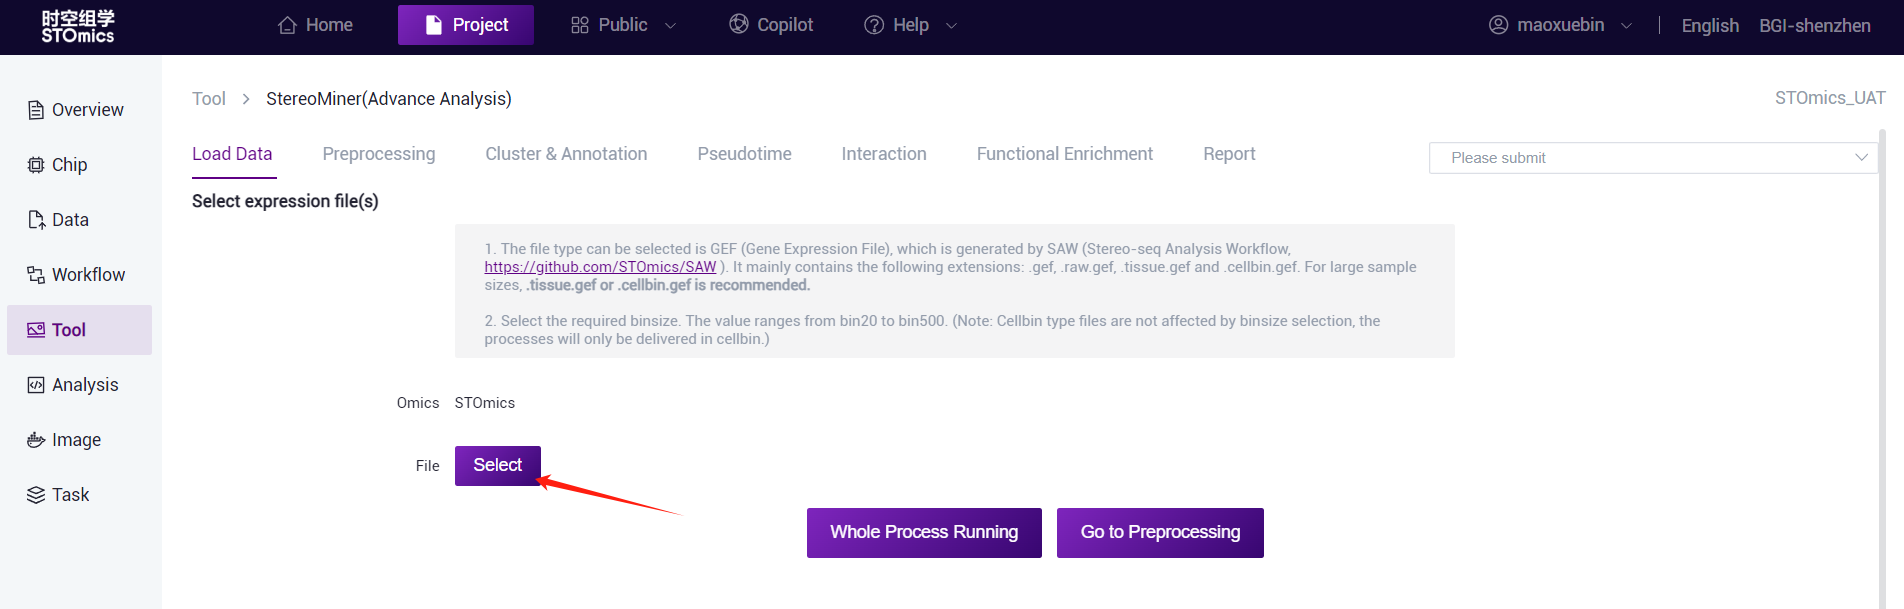
- Enables you to add multiple files, select different binsize, and submit tasks simultaneously.
Tips
please note :
For *.cellbin.gef, there is no need to select binsize, and only cellbin tasks will be submit.
scMiner (Advance Analysis)
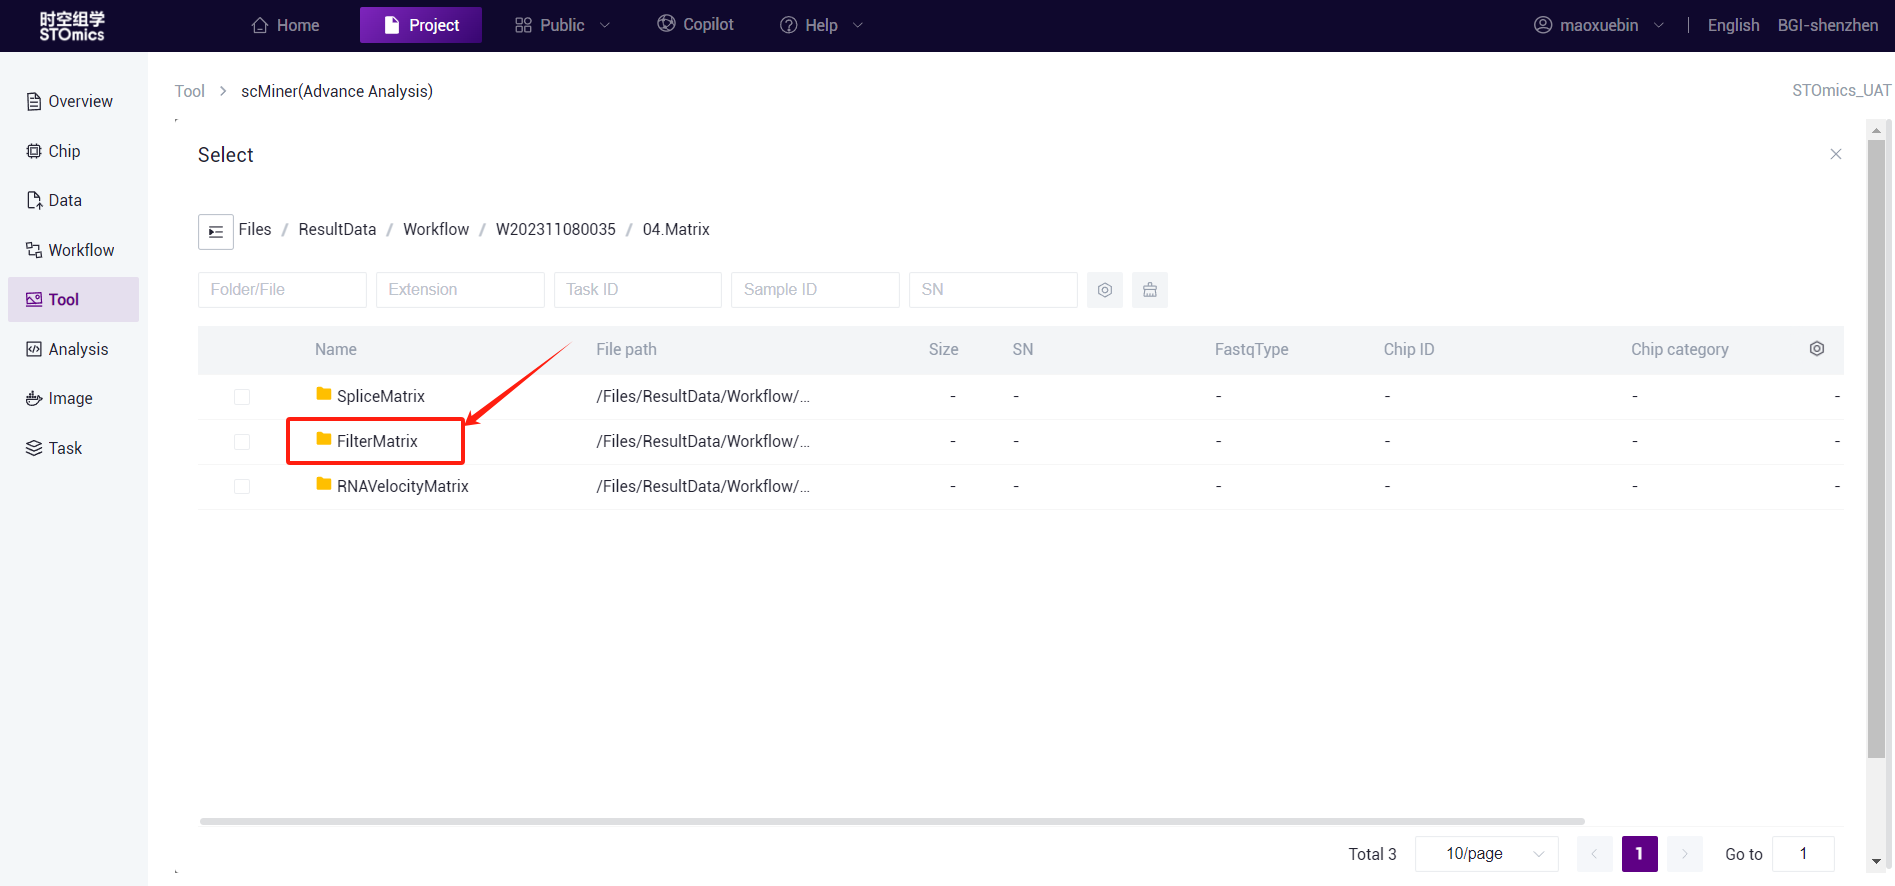
Select the folder where the output results of the upstream single‑cell process are located, which must directly contain the following three files: "features.tsv.gz", "barcodes.tsv.gz", and "matrix.mtx.gz".
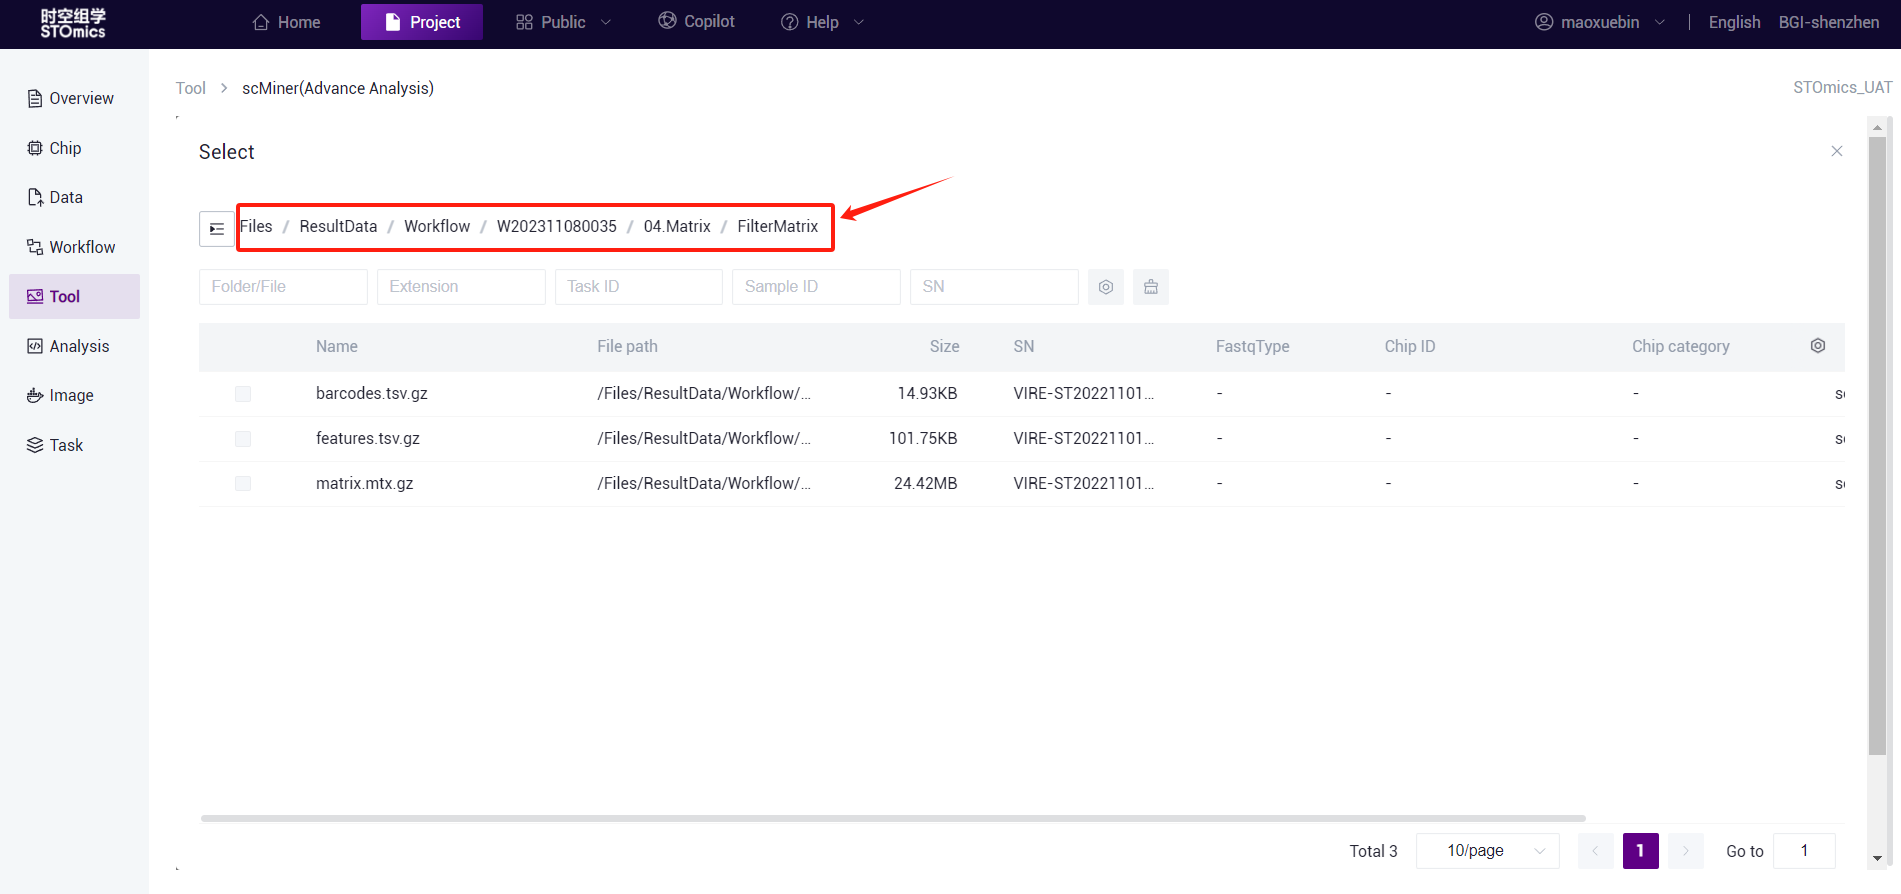
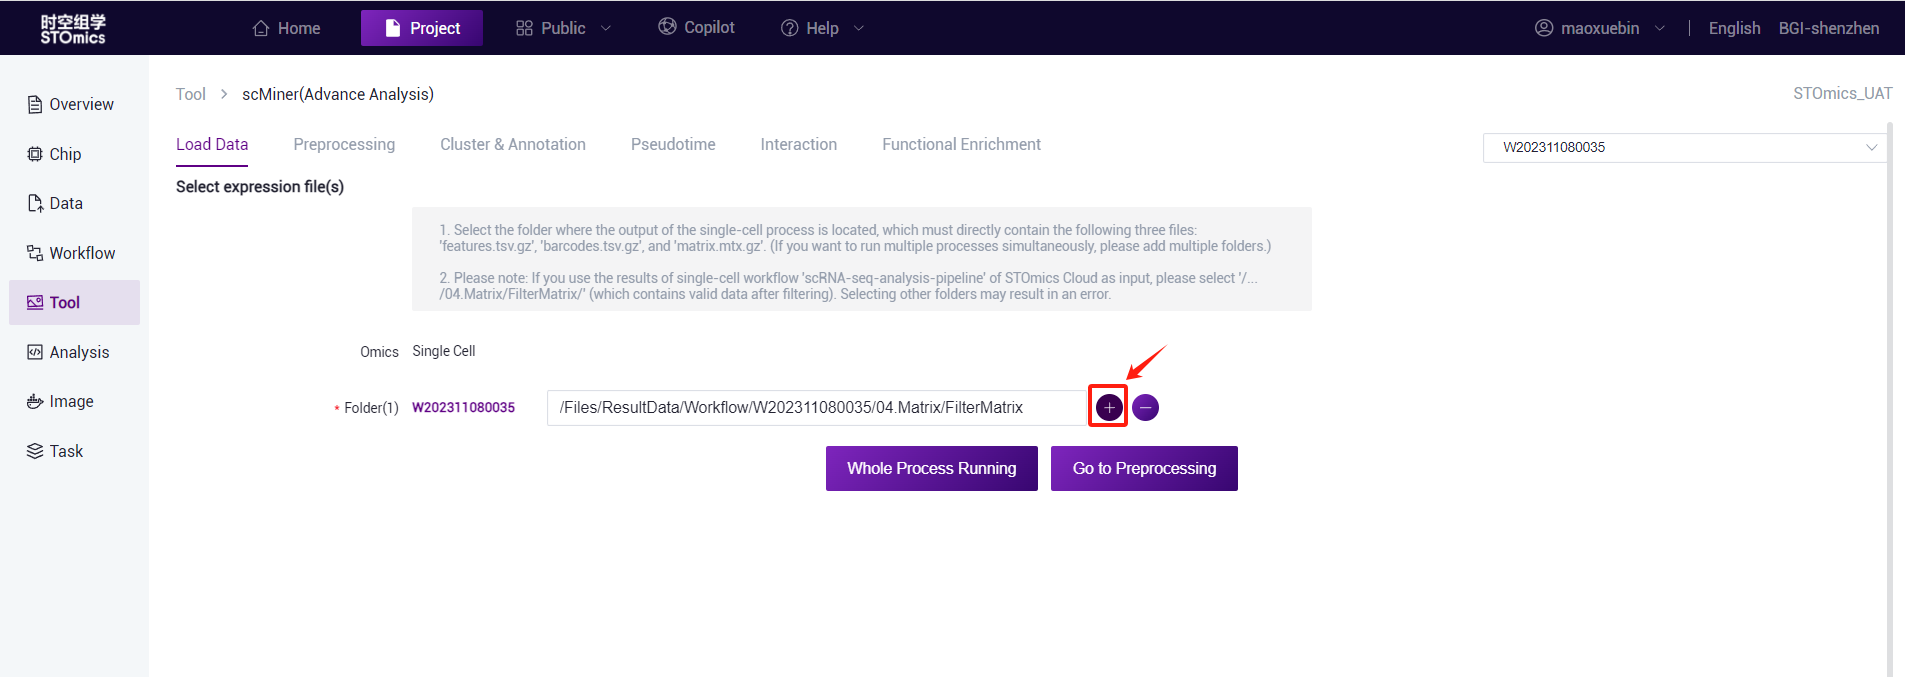
- Note: If you use the DCS Cloud single‑cell workflow "scRNA‑seq‑analysis‑pipeline" output results, please select "/... /04.Matrix/FilterMatrix/ "folder (this matrix is valid data after filtering), if you choose another folder may result in an error.
- If you need to run multiple processes at the same time, click the "+" sign to add multiple folders.
Task delivery
- Full process delivery or single step delivery (submission preprocessing) is optional.
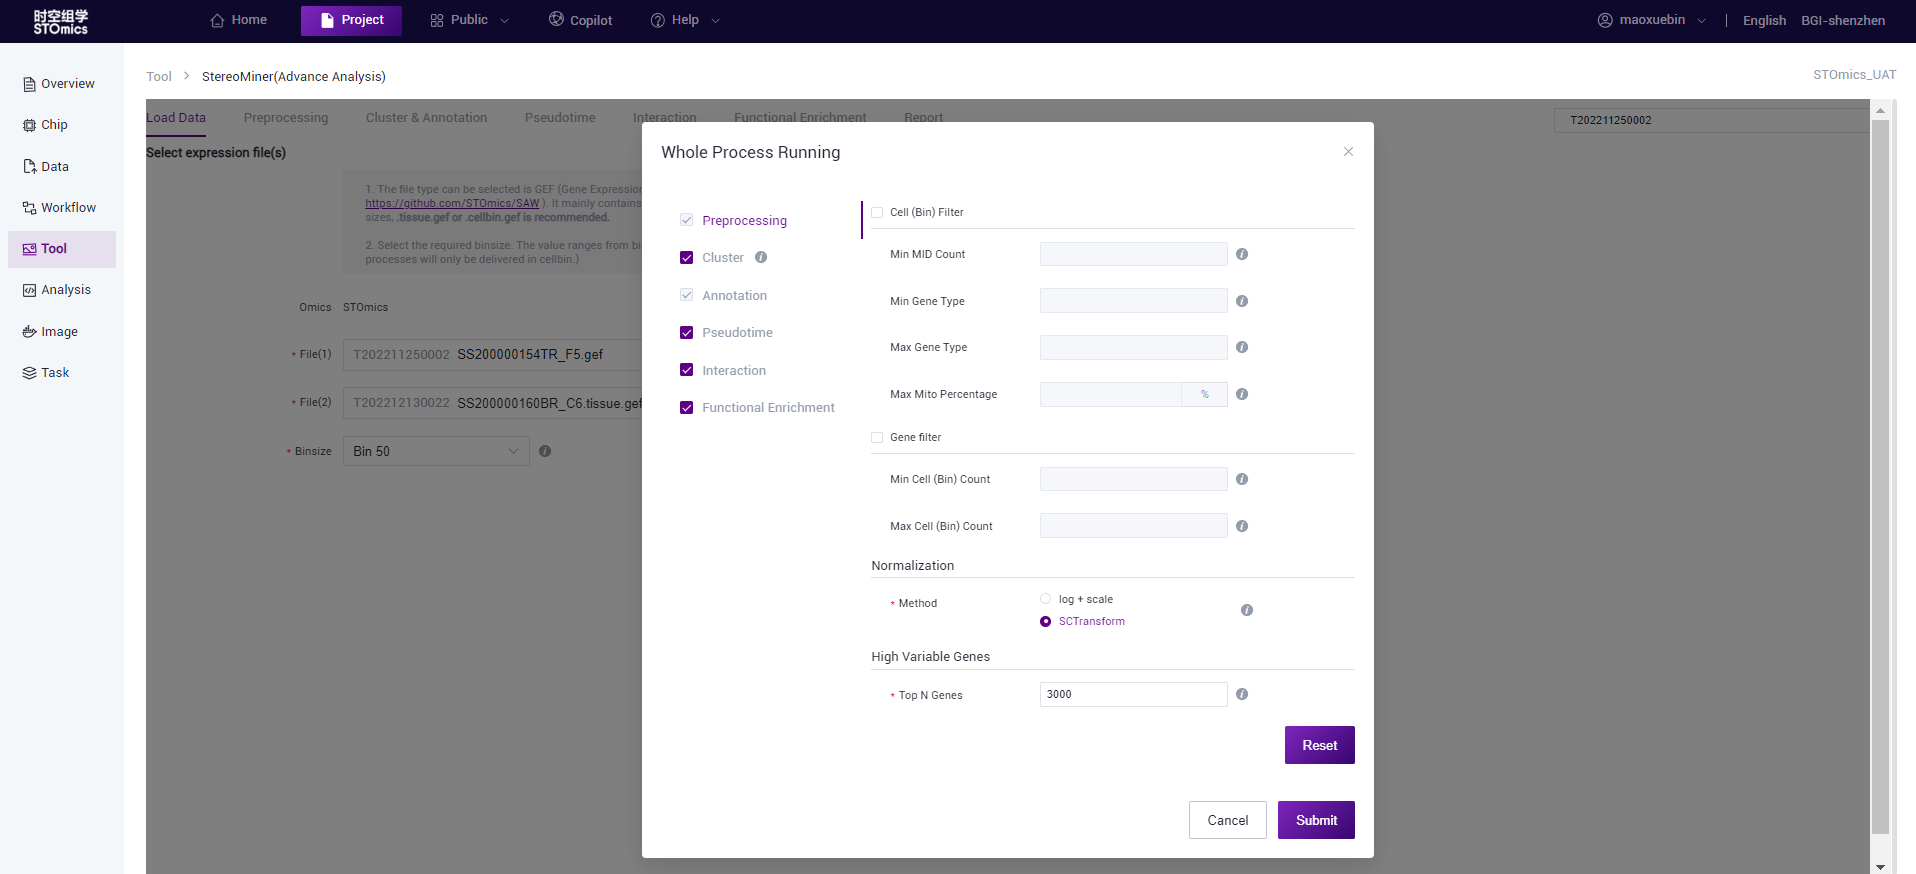
- Full process delivery: After selecting the file, click "Whole Process Runing", you can select the process and set the parameters, and you can complete the selected process at one time after submission (pre‑processing and annotation process are required).
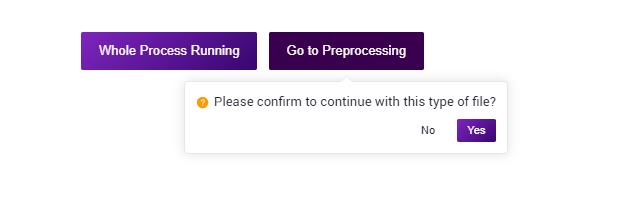
- Go to Preprocessing:After selecting the file, click "Go to Preprocessing", then only single‑step process delivery, stop after running the pre‑processing, the user can view the results and proceed to the next delivery.
Task result viewing
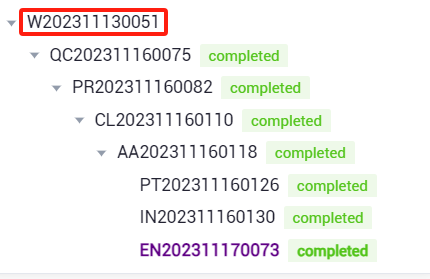
- You can view a task after the analysis is complete and switch process results in the task list.
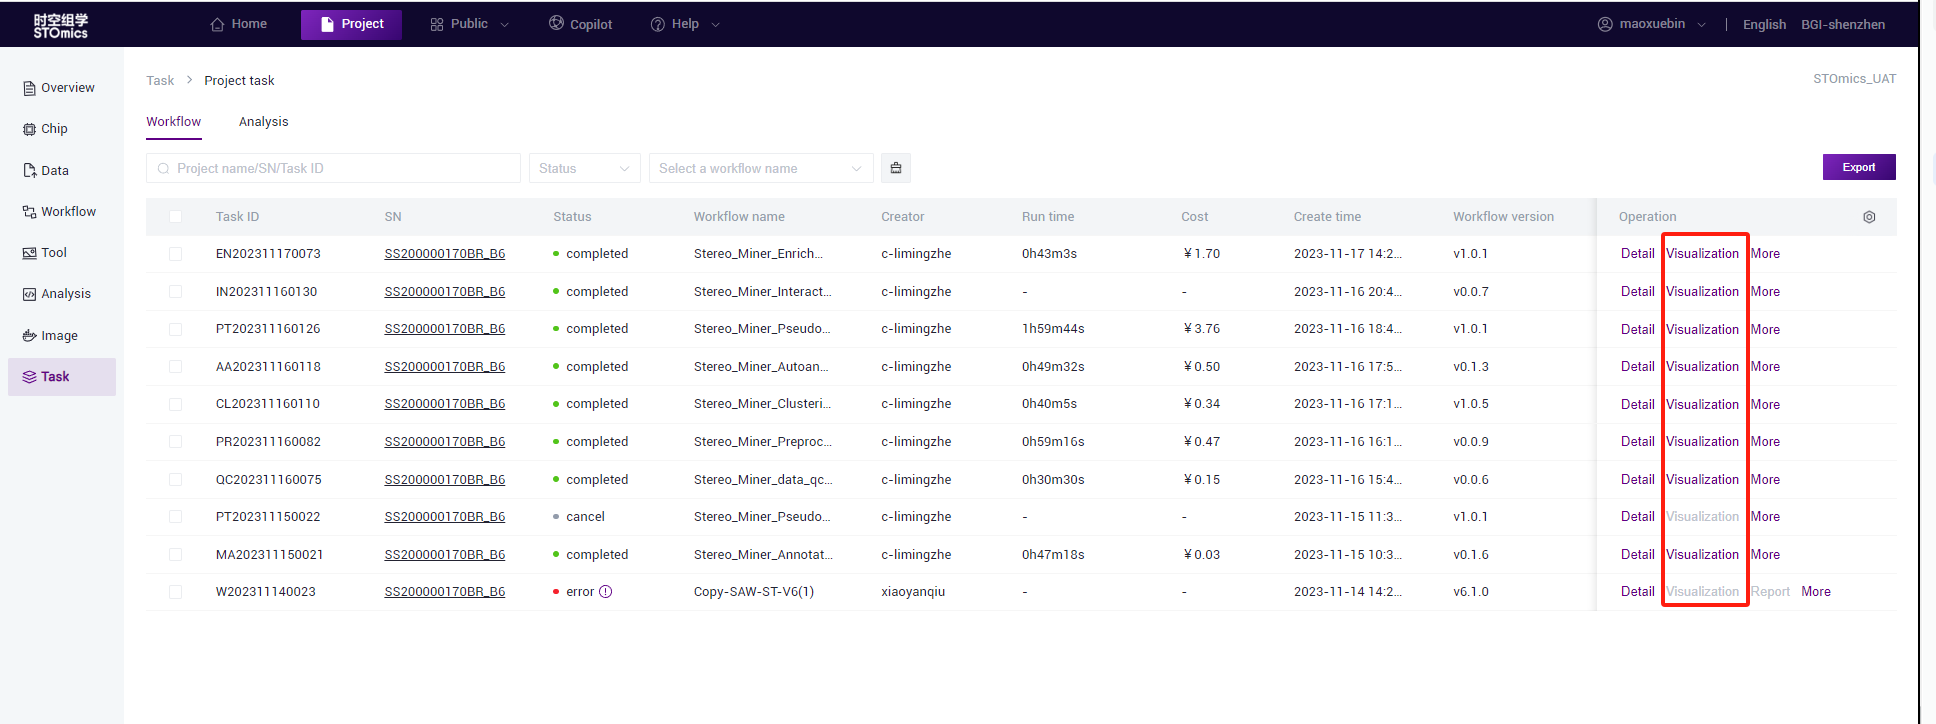
- The task list is in a tree structure to show the dependencies between processes. The users can determine which pre‑task the result of the task is based on.
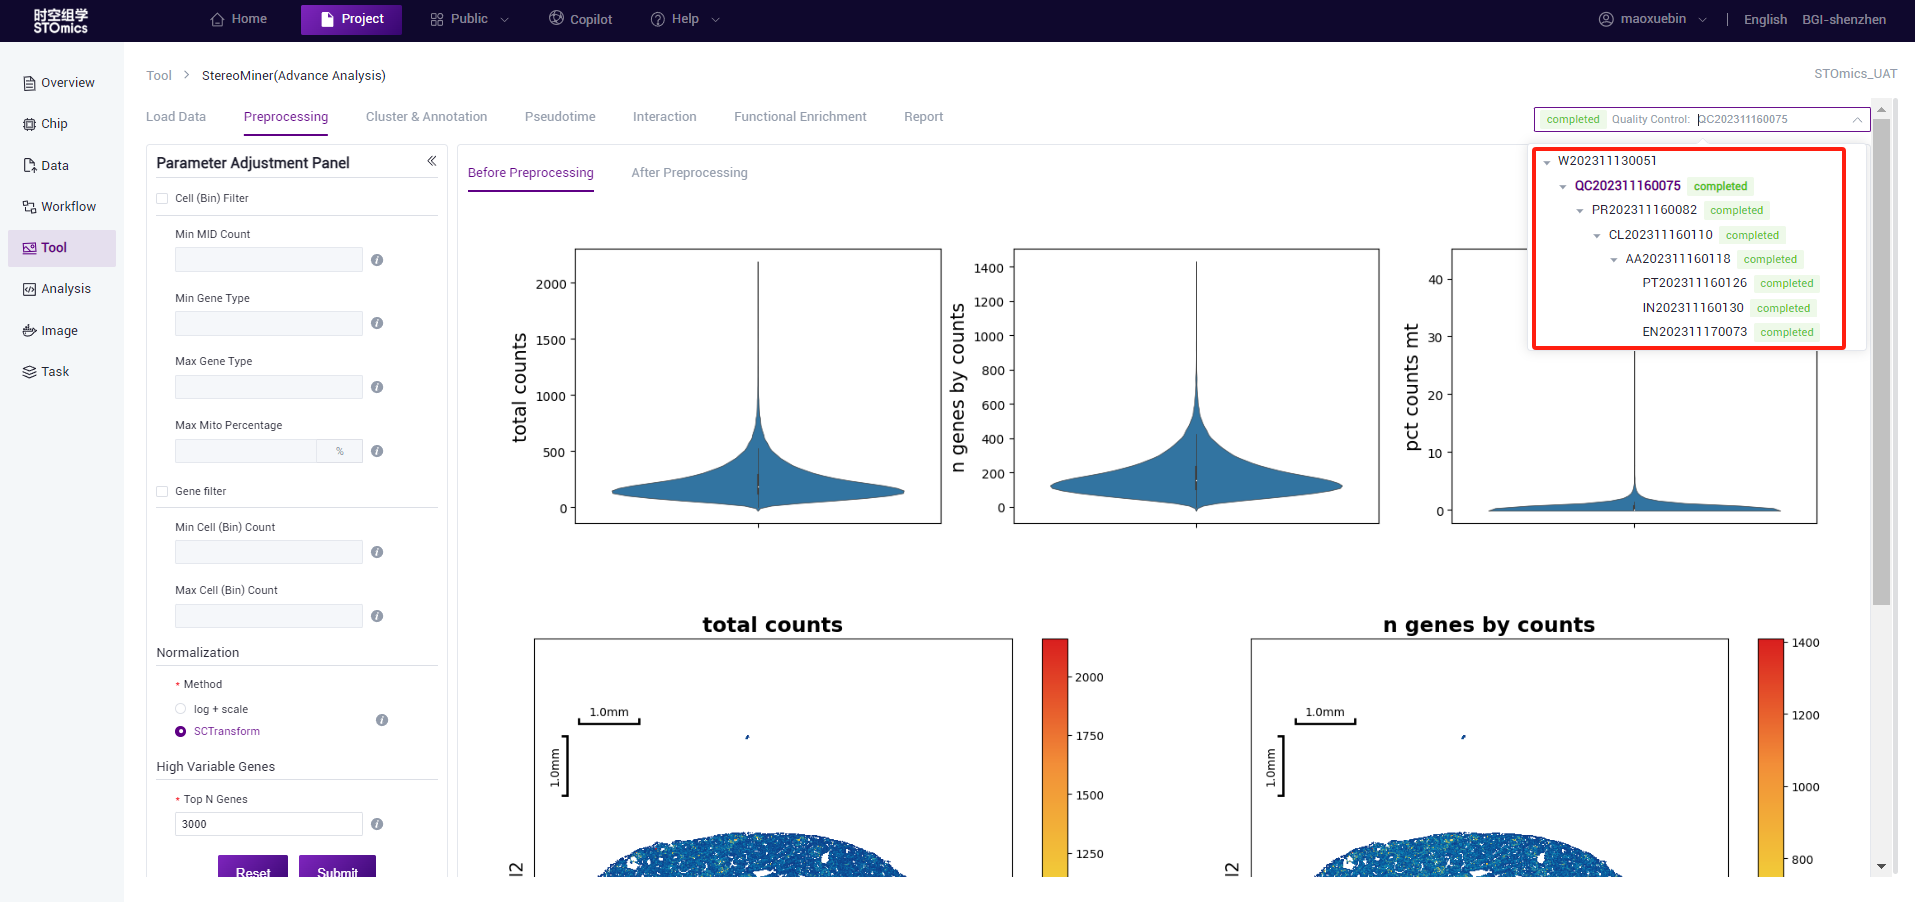
- If you need to view the analysis results of other chips, you can replace the file on the “Load data” page. The historical tasks of the file are synchronized to the task list on the right. If no historical tasks exist, the list is empty.
Quality control process
The MID Count, Gene Type, mitochondrial gene ratio of the gef file were counted. The procedure was expected to take 30 minutes (1*1cm chip, 1G reads). After the analysis is completed, you can view the task (task number at the beginning of QC) on the task results page, and enter the result view by viewing the report button. Analysis results data can also be downloaded.
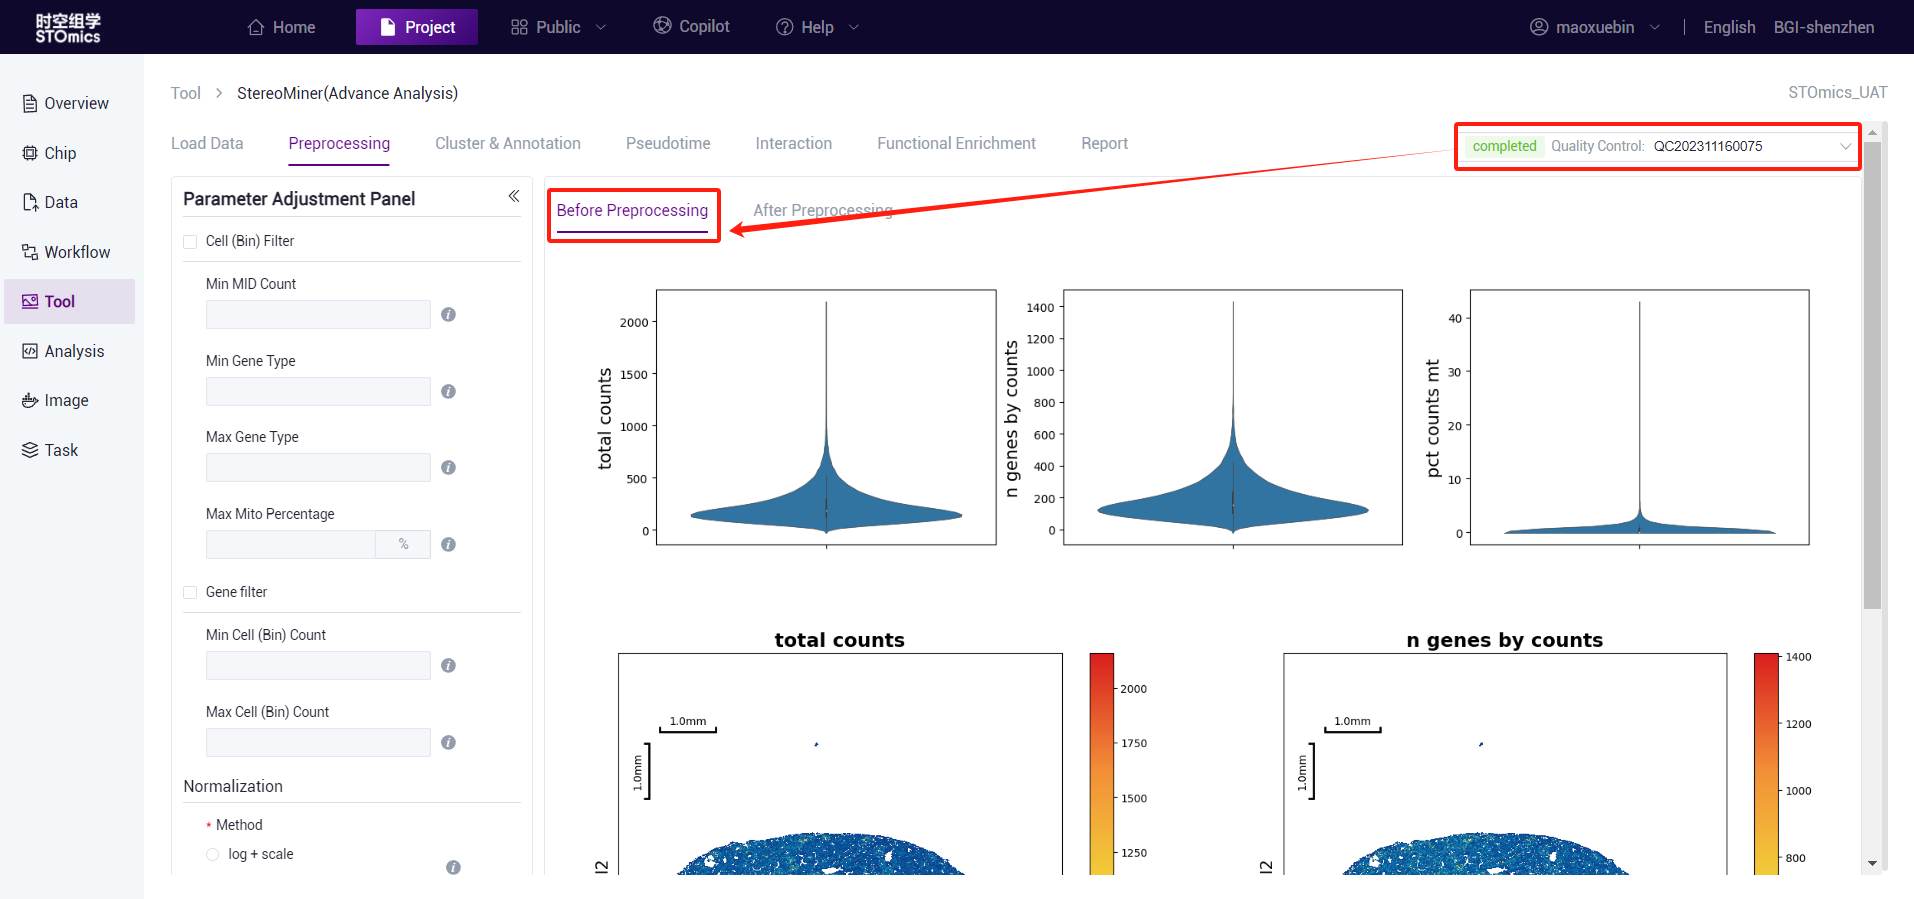
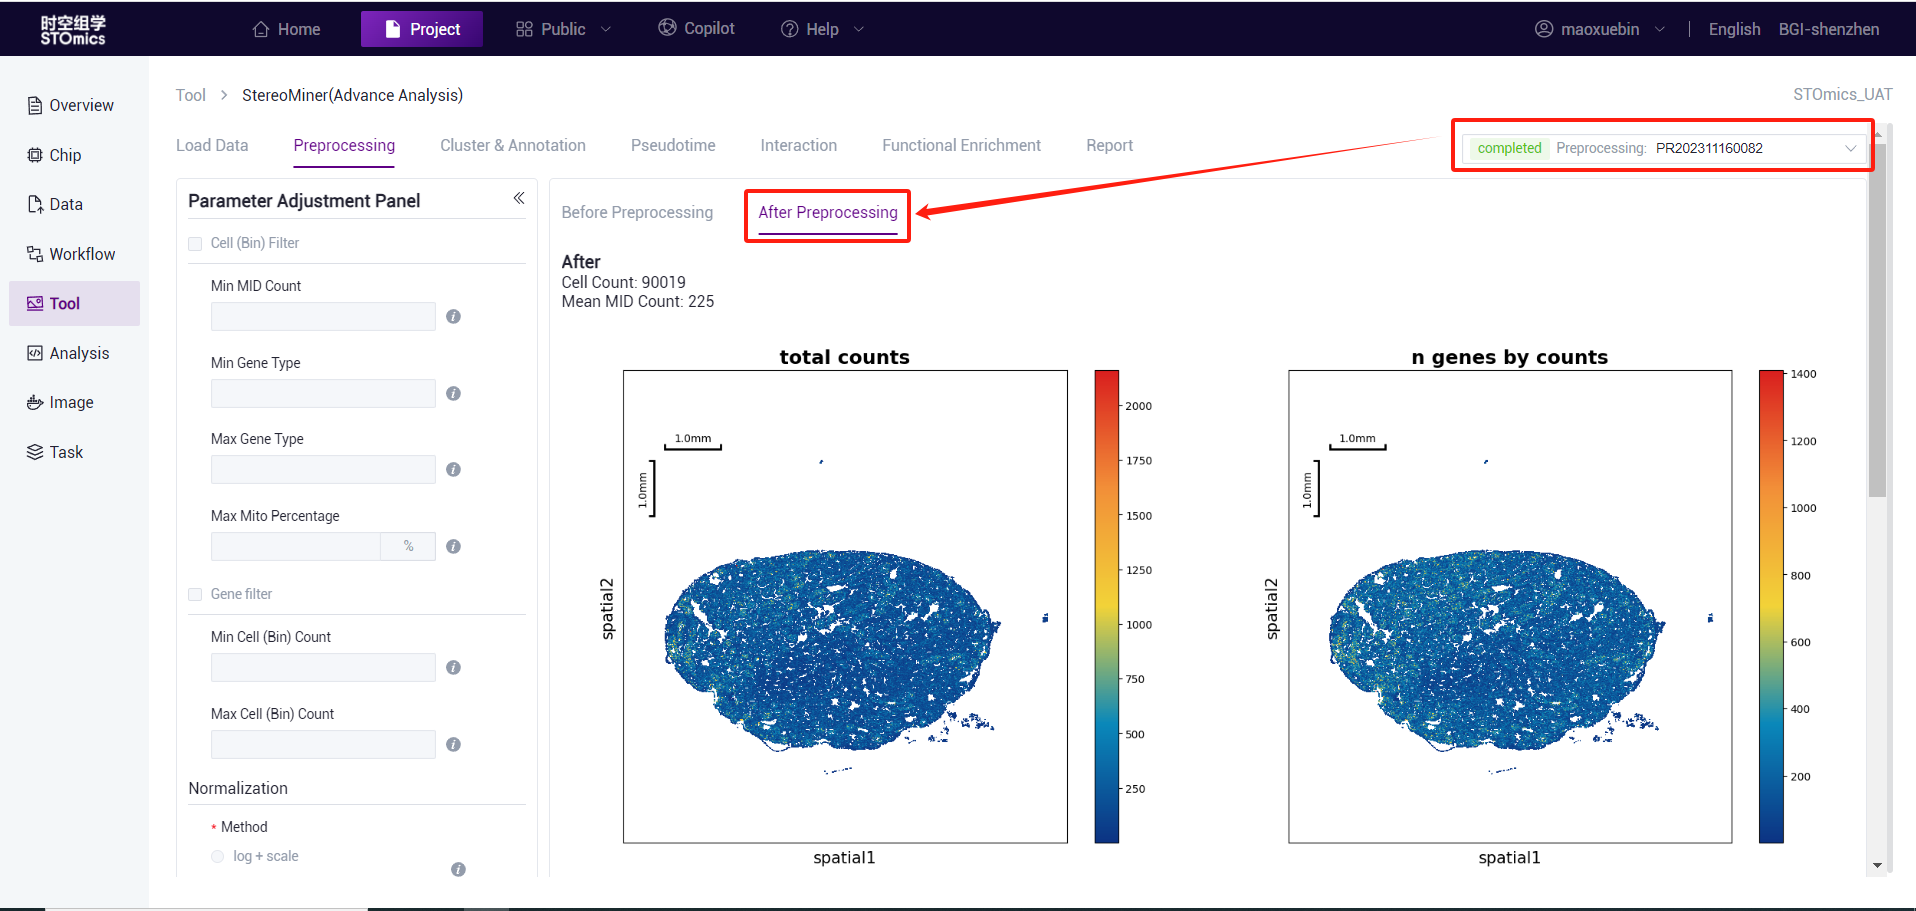
Preprocessing process
According to the preliminary statistical results, the gef files were preprocessed by cell filter, gene filter, normalize, and highly variable genes. This step is expected to take 15 minutes (1*1cm chip, 1G reads). After the analysis is complete, you can view the task (task number starting with PR) on the task result page. Click the View Report button to enter the result view. Analysis results data can also be downloaded.
Note
The preprocessing analysis algorithm calls the stereopy tool algorithm. If Min MID Count and Top N Genes are used at the same time, it is easy to filter all valid data. In this case, the system defines the two parameters as None.
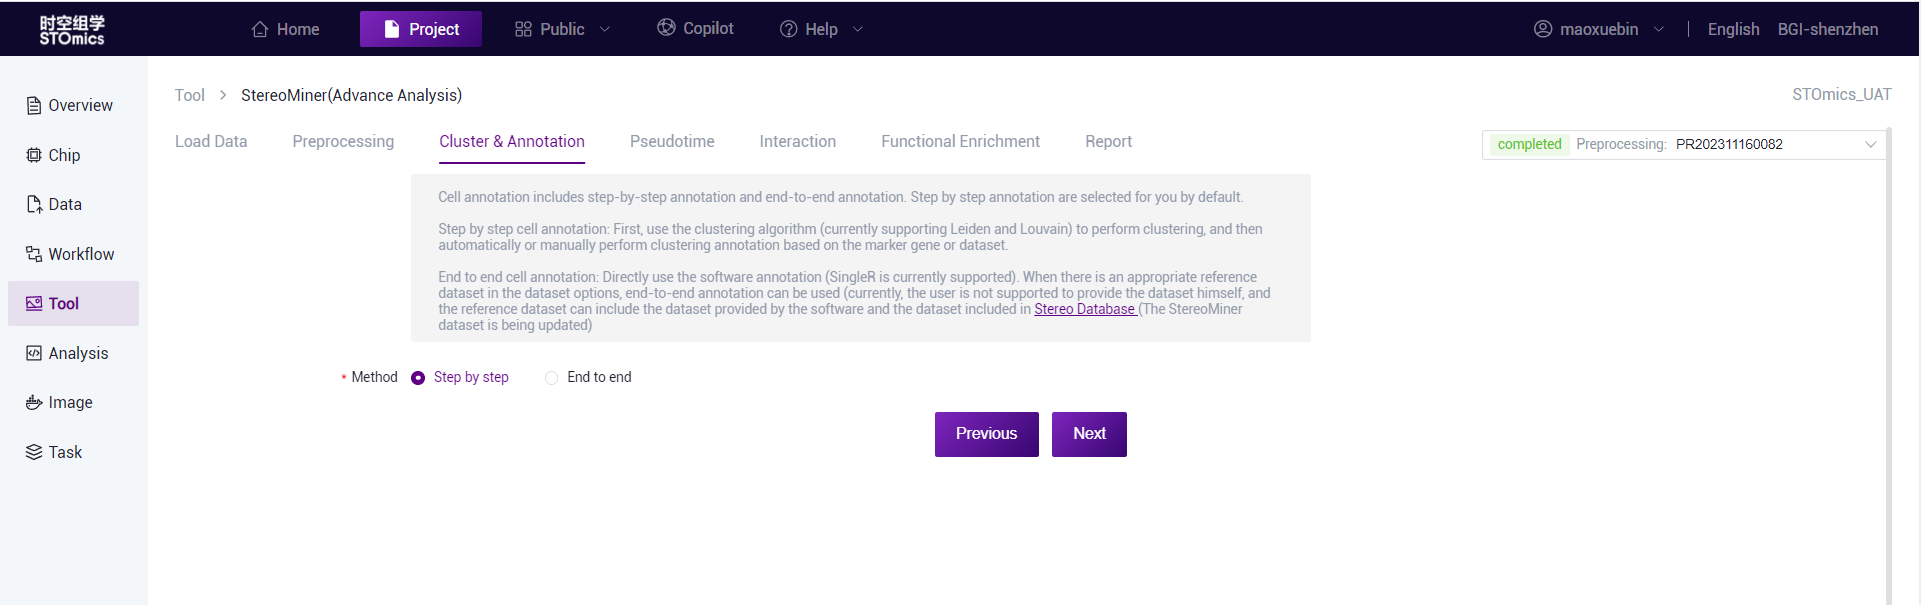
Annotation method selection
Cell annotation supports step‑by‑step annotation and end‑to‑end annotation. By default, step‑by‑step comments are selected for you,scMiner(Advance Analysis) recommends the use of step‑by‑step annotations, as end‑to‑end annotations do not produce UMAP images.
Step‑by‑step annotation: First, clustering is performed using a clustering algorithm (Leiden/Louvain using Stereopy or Spateo software is currently supported), and then clustering annotation is performed automatically or manually based on Marker genes or data sets.
End‑to‑end annotation: Use software annotations directly (SingleR is currently supported).
Cluster
After the preprocessing, cluster and marker gene analysis were carried out. This procedure is expected to take 35 minutes (1*1cm chip, 1G reads). After the analysis is completed, you can view the task (task number at the beginning of CL) on the task results page, and enter the result view by viewing the report button. Analysis results data can also be downloaded.
::: Note: cluster and find marker analysis can only be performed after the preprocessing is complete.
cluster and find marker analysis algorithms called stereopy tool algorithm. :::
- After setting the cluster analysis parameters, click the "Submit" button for analysis.
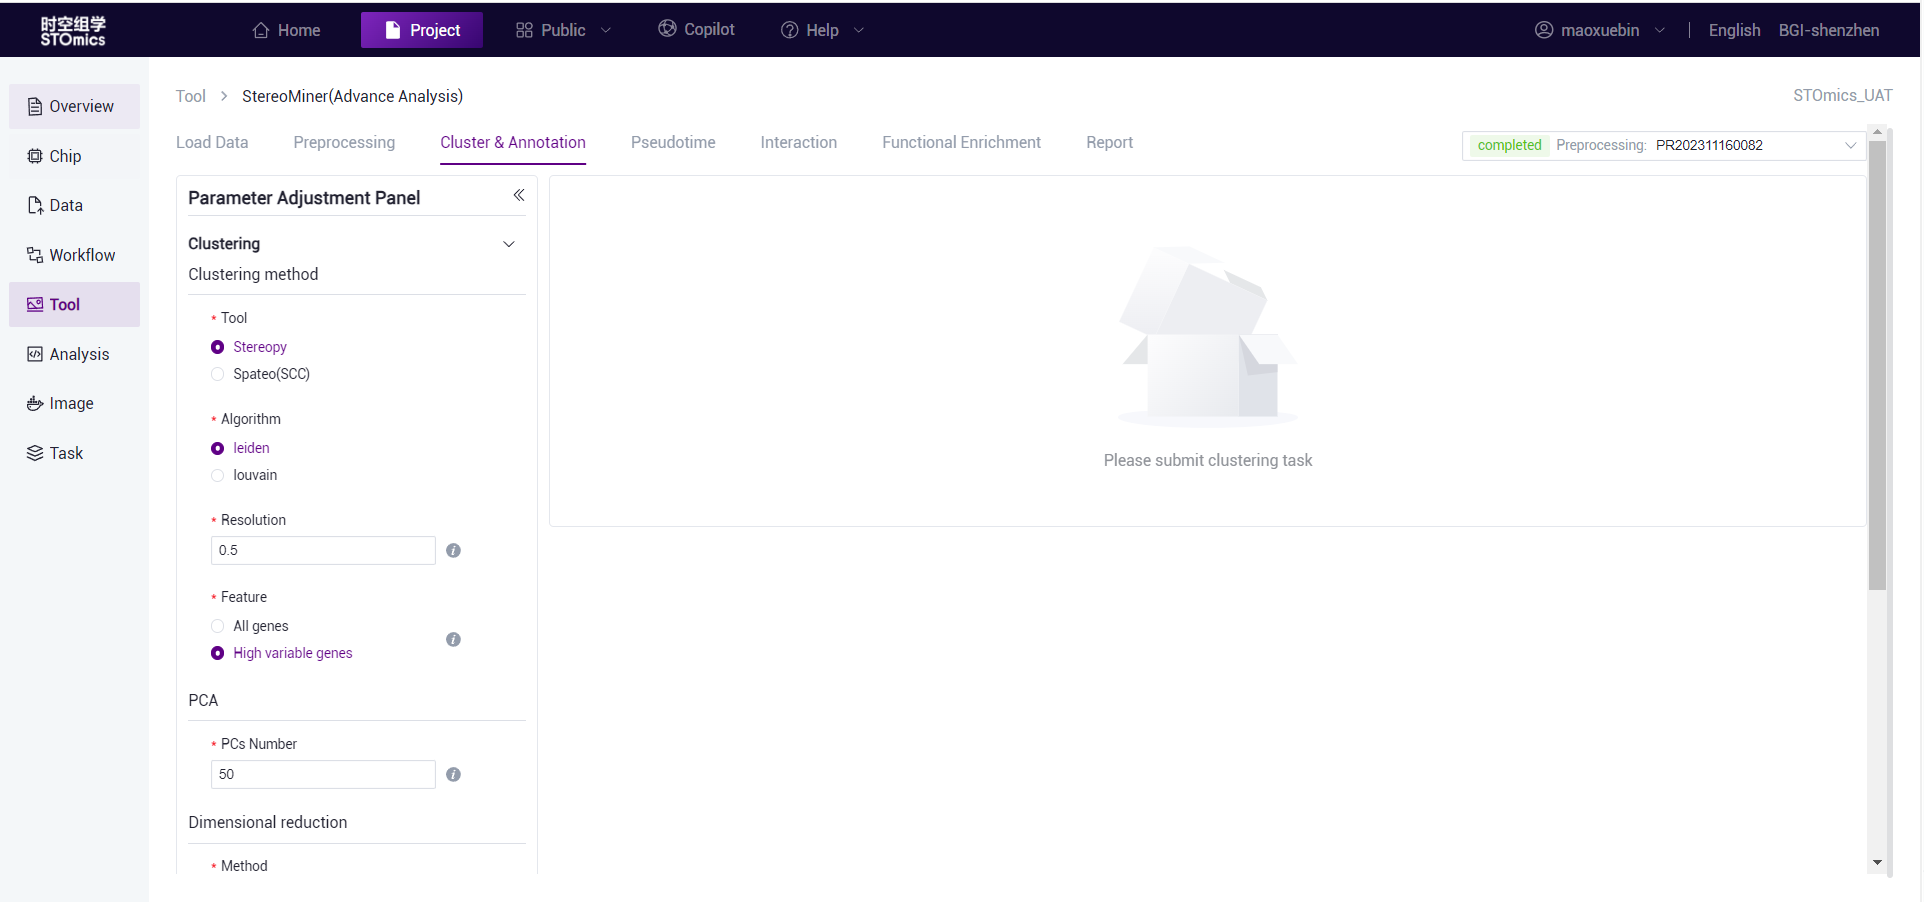
After the task is submitted, the page displays the task analysis waiting.
After the analysis is completed, you can view the task (task number at the beginning of CL) on the task results page, and enter the result view by viewing the report button. View spatial and UMAP visualizations.
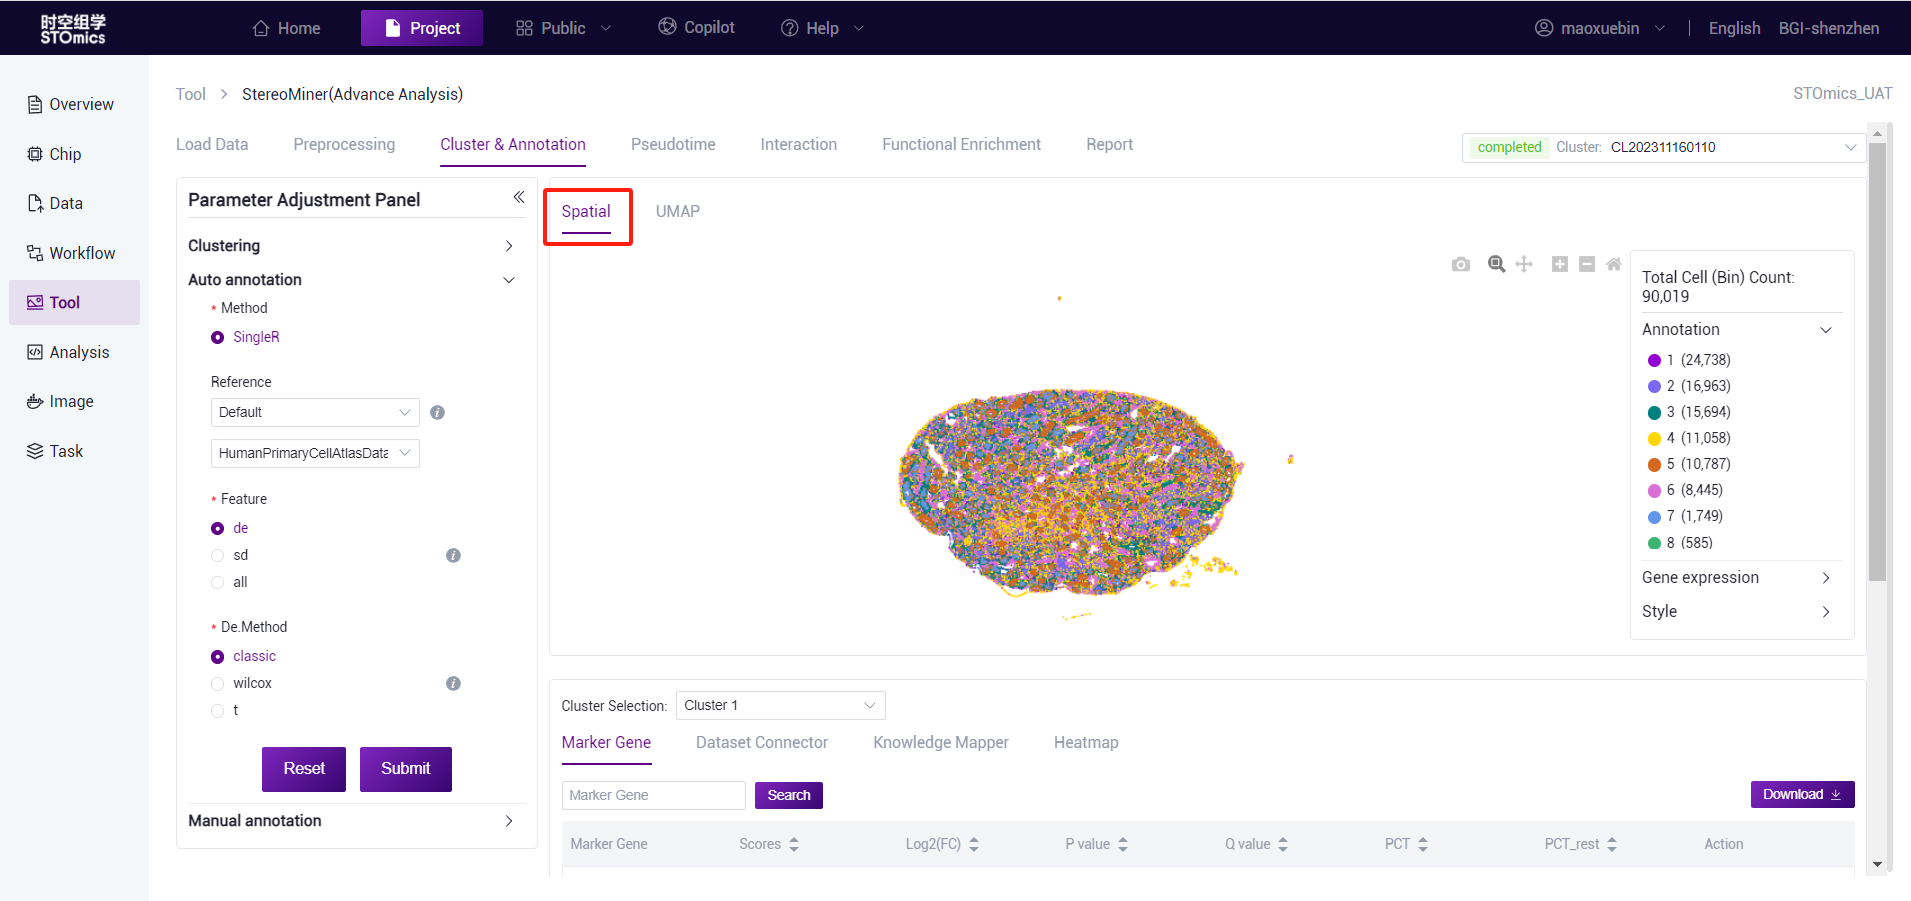
cluster analysis results spatial visualization page
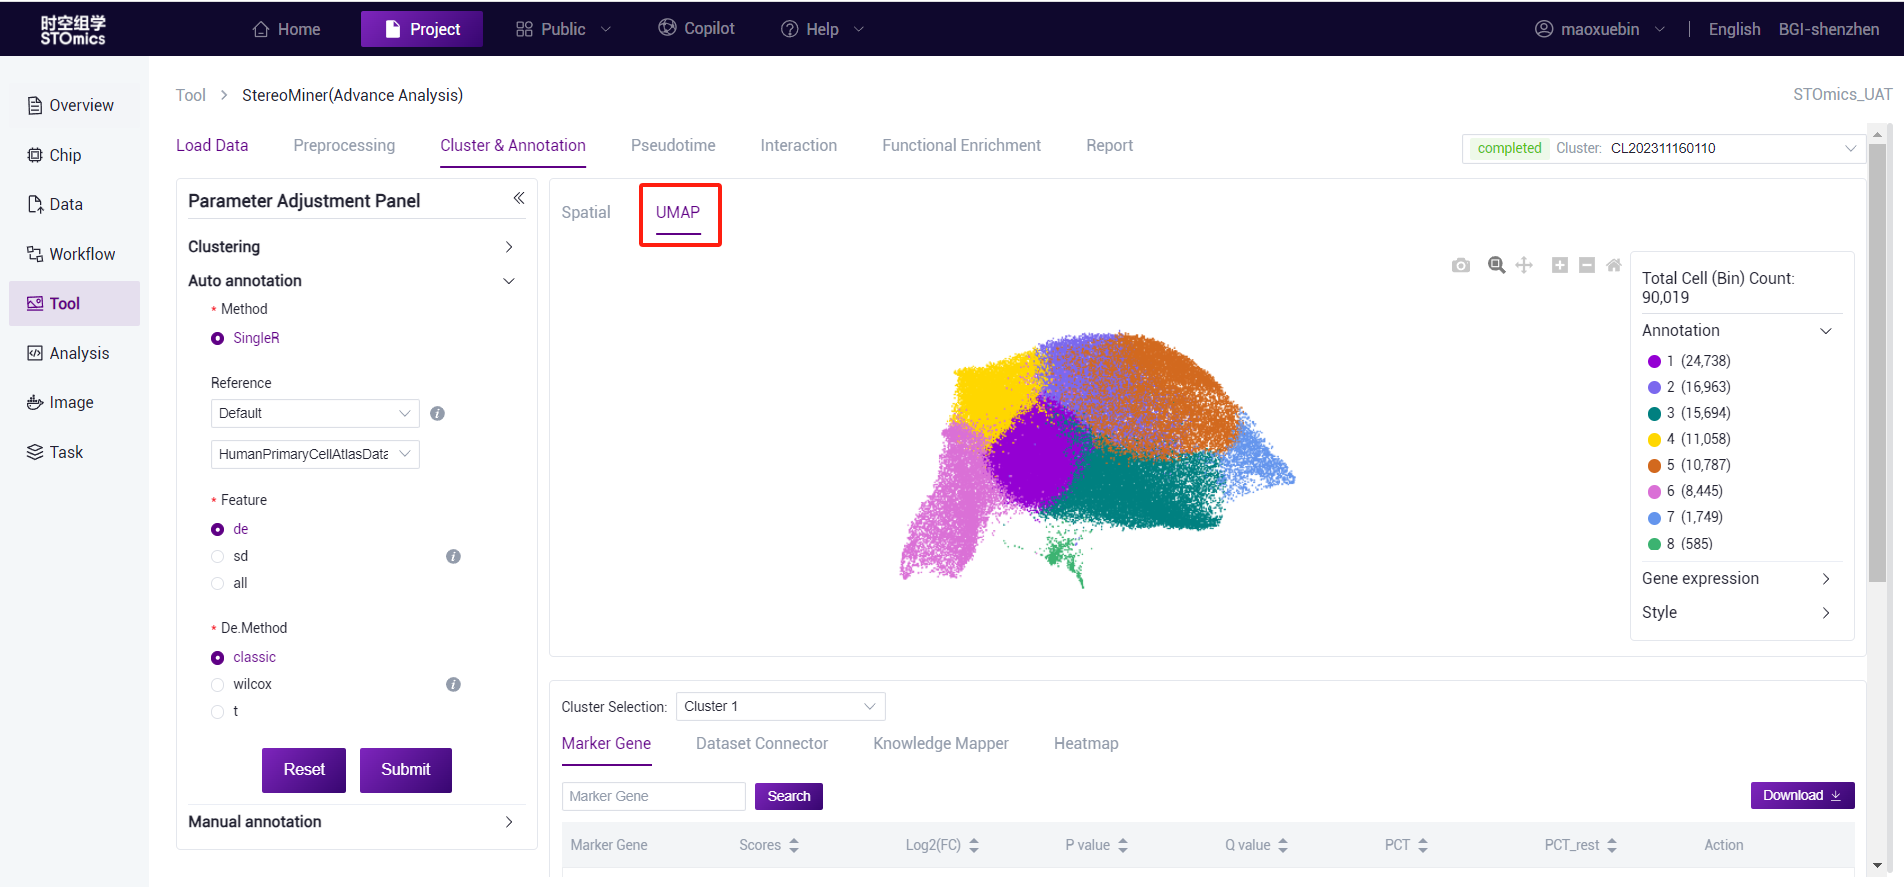
cluster analysis results UMAP visual page
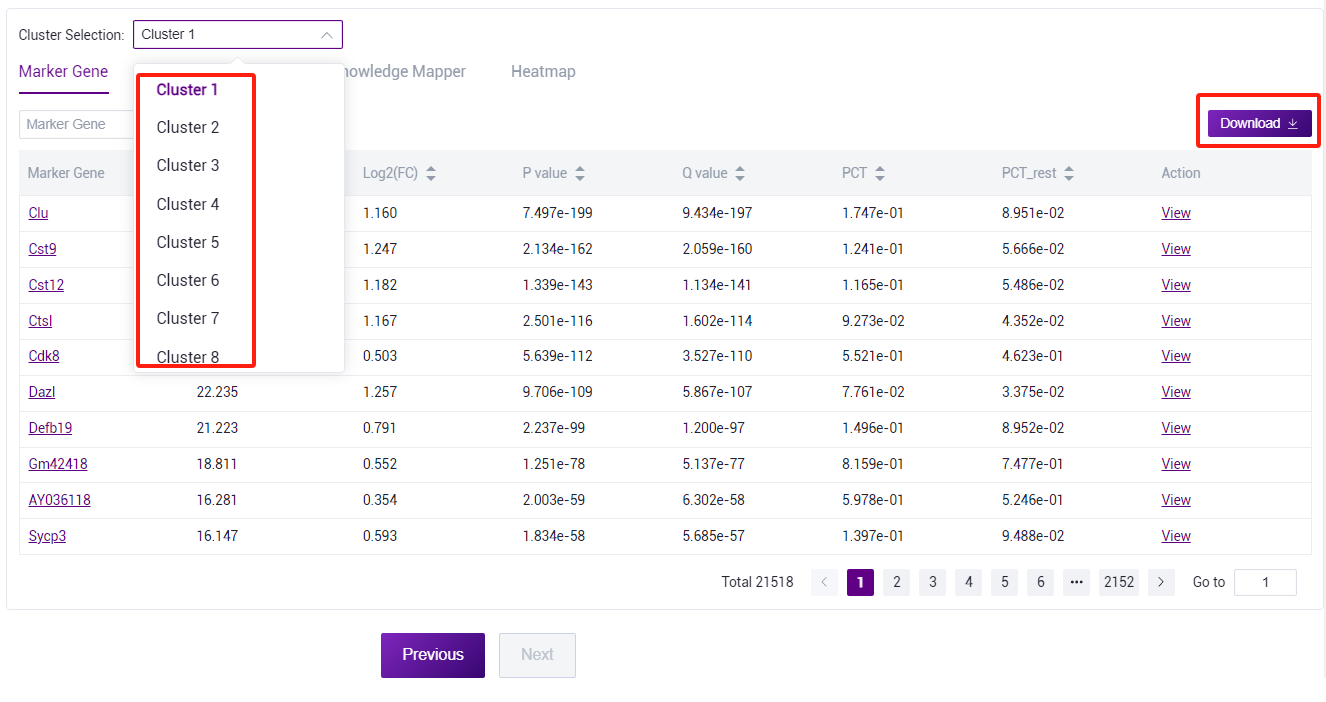
- Switch cluster, you can view all marker gene of different cluster. Tables can be searched, sorted, and downloaded.
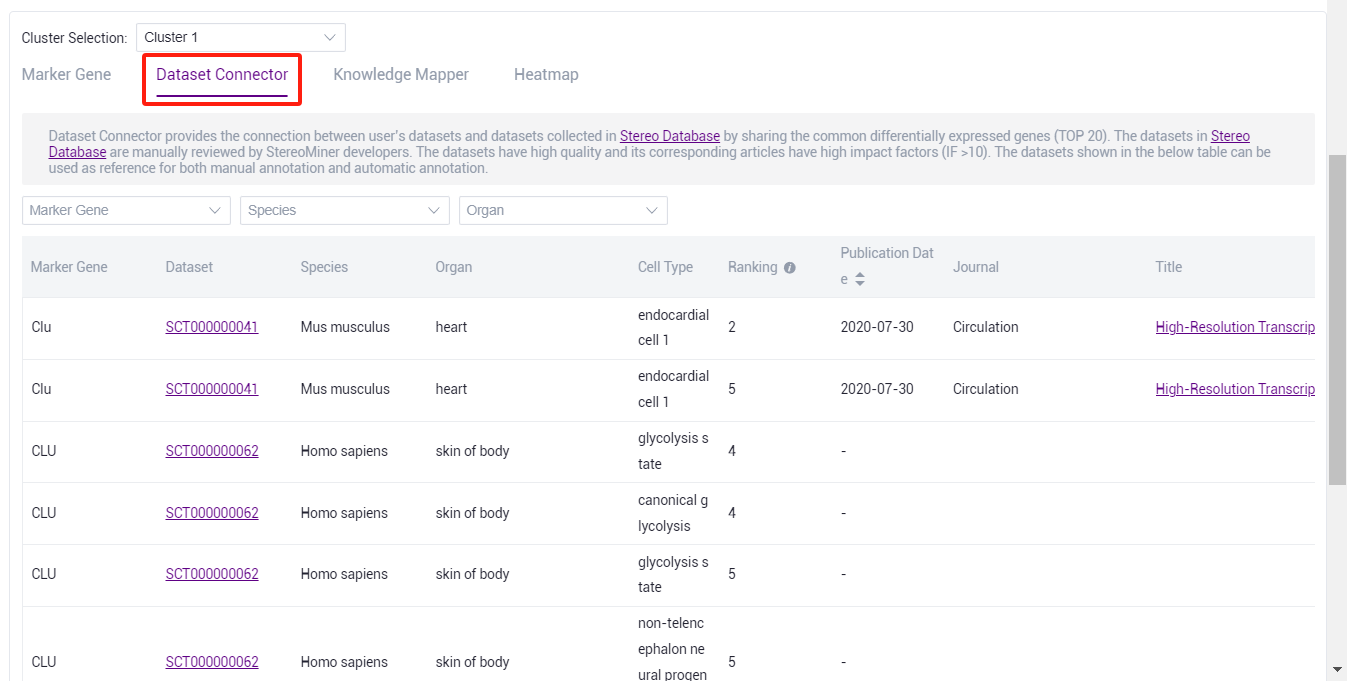
- Through the dataset connector, the cell type corresponding to the marker gene in the dataset can be viewed for manual annotation reference.
::: Note: Stereominer collected species 200 + data sets in different tissue of mouse and human, and human review and processing, detailed at https://www.stomics.tech/sap/stereominer/database/#/study/. :::
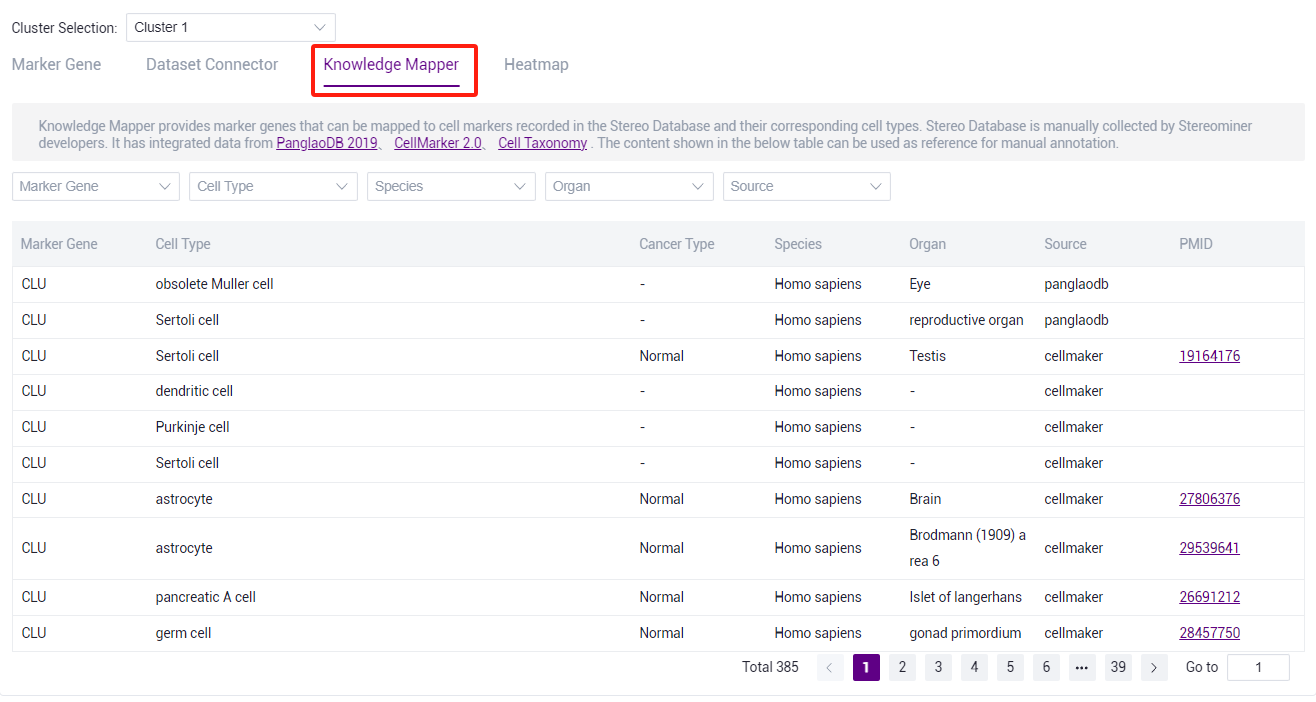
- Through the knowledge mapper, you can view the cell type corresponding to marker gene in the knowledge base for manual annotation.
::: Note: The knowledge base is the content of database such as panglaodb, cellmarker, Cell Taxonomy. Manual annotation can be used for reference. :::
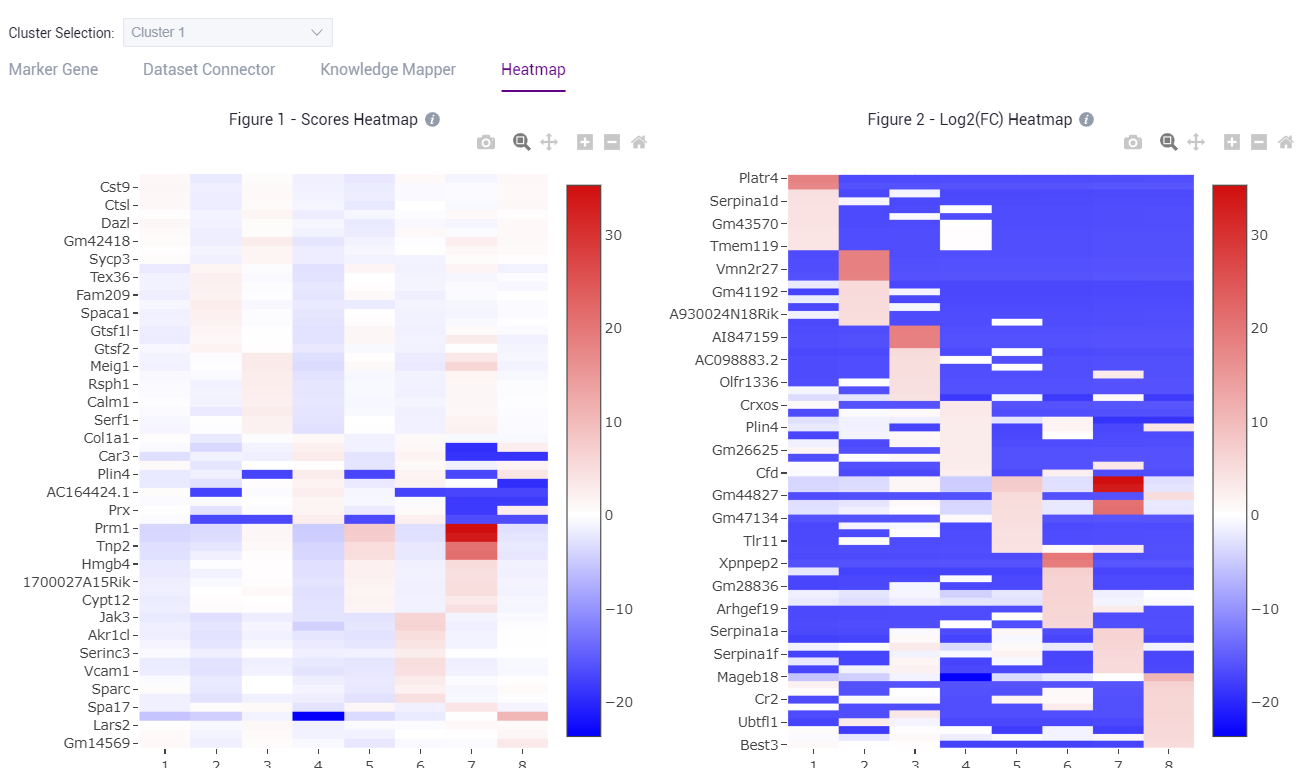
- Check the marker gene expression heatmap.
Automatic annotation
- After different cell clusters are obtained through cluster analysis, in addition to using Marker gene information of each cluster for preliminary annotation and analysis of cell clusters, other software can also be used to compare cell cluster with reference databases to obtain cell annotation information of different cells after clustering.
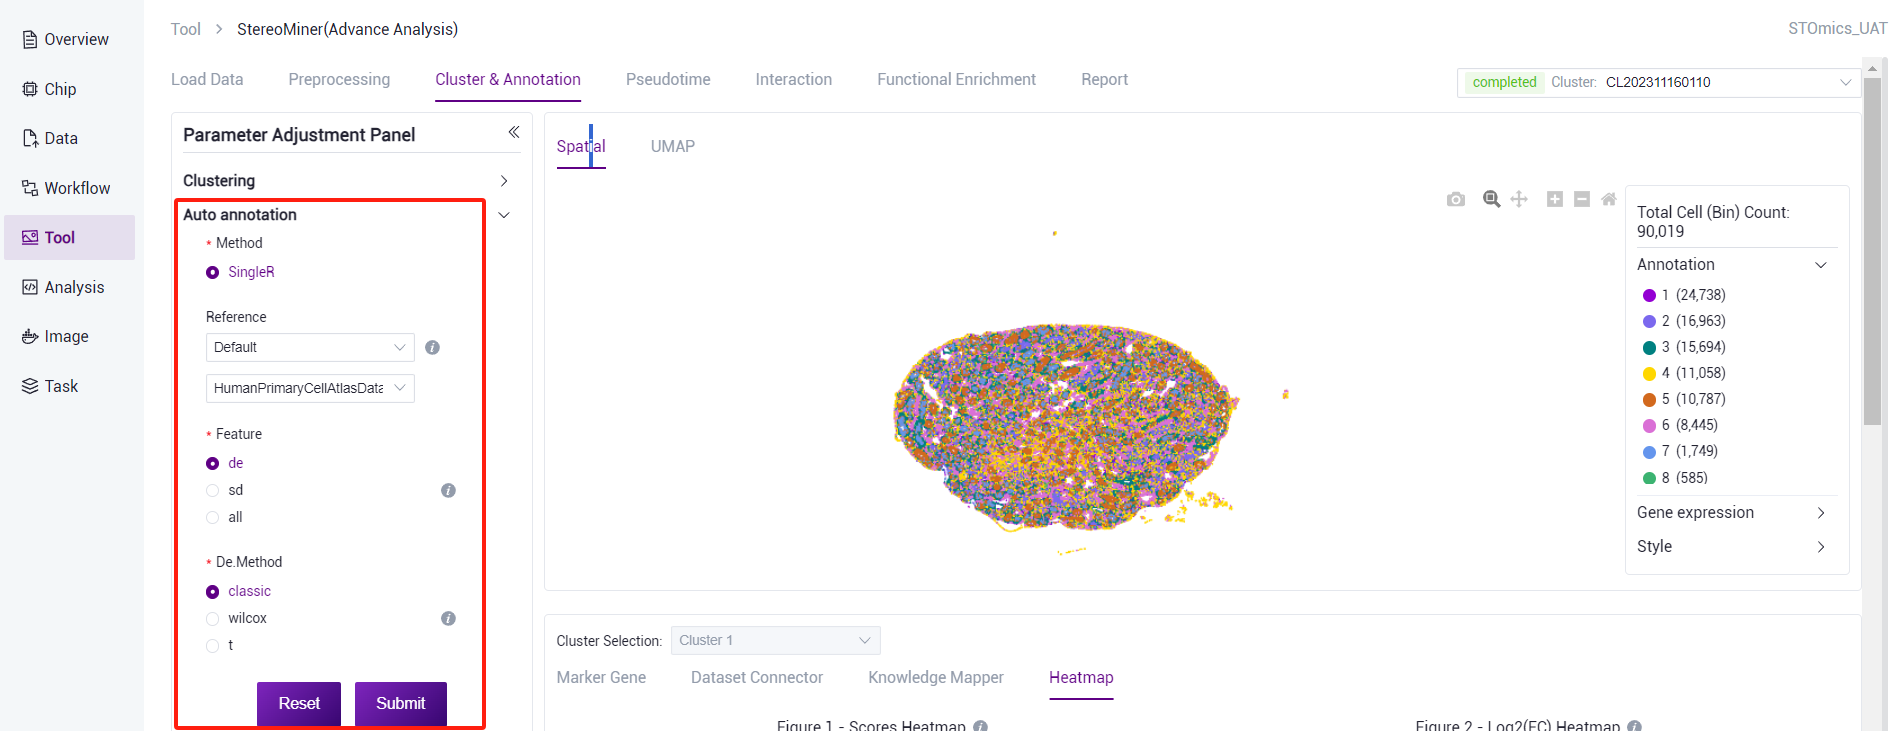
SingleR can compare each cluster in the cell clustering results with the reference database, score the cluster based on its similarity to the gene expression profiles of known cell clusters in the reference database, and finally obtain a scoring matrix. The cell clustering results can be annotated into different cell cluster by scoring the matrix results. This step is expected to take 60 minutes (1*1cm chip, 1G reads). After the analysis is complete, you can view the task (task number starting with AA) on the task result page. Click the View Report button to view the result. Analysis results data can also be downloaded.
There are three ways to choose from the reference dataset:
- SingleR comes with data set: Select "Default" and select reference data corresponding to human/mouse from the drop‑down list.
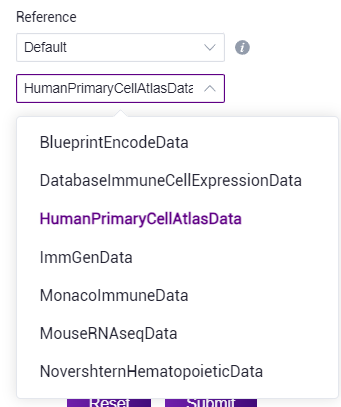
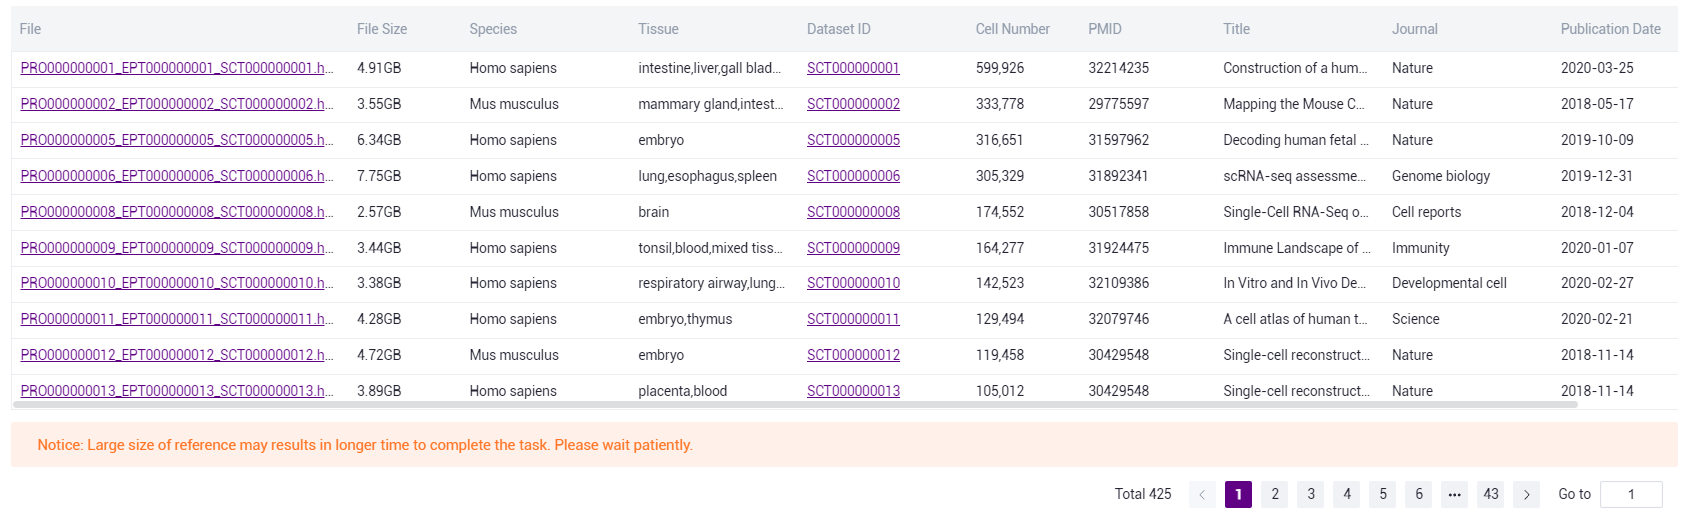
- Knowledge Base dataset: Select "Stereo Database" to select the data contained in the knowledge base based on the information provided.
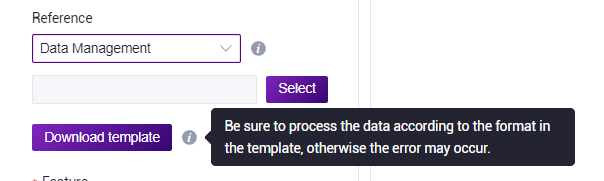
- Data Management: Select "Data Management". You can go to the Data Management page to customize reference data. (Note: Please download the template file first, build your own reference data and upload it to data management.)
- You can also skip the automatic annotation and directly perform manual annotation after the clustering is finished.
Manual annotation
Manual annotation can be made after cluster annotation or automatic annotation. If manual annotation is performed after automatic annotation, the system will display the result of automatic annotation in the first column of manual annotation. You can complete the annotation by clicking the Edit button to modify the cell type. After manual annotation, you can also re‑cluster or automatically annotate. Please note that the results of manual annotation will be reset if you re‑make automatic annotation. Manual annotation is expected to take 20 minutes (1*1cm chip, 1G reads).
- According to marker gene and Knowledge Base dataset reference, manually annotate the cell type of the cluster (edit/delete operation is supported, and will be displayed as "nan" after deletion). After editing the different cluster cell types, click the "Submit" button for analysis.
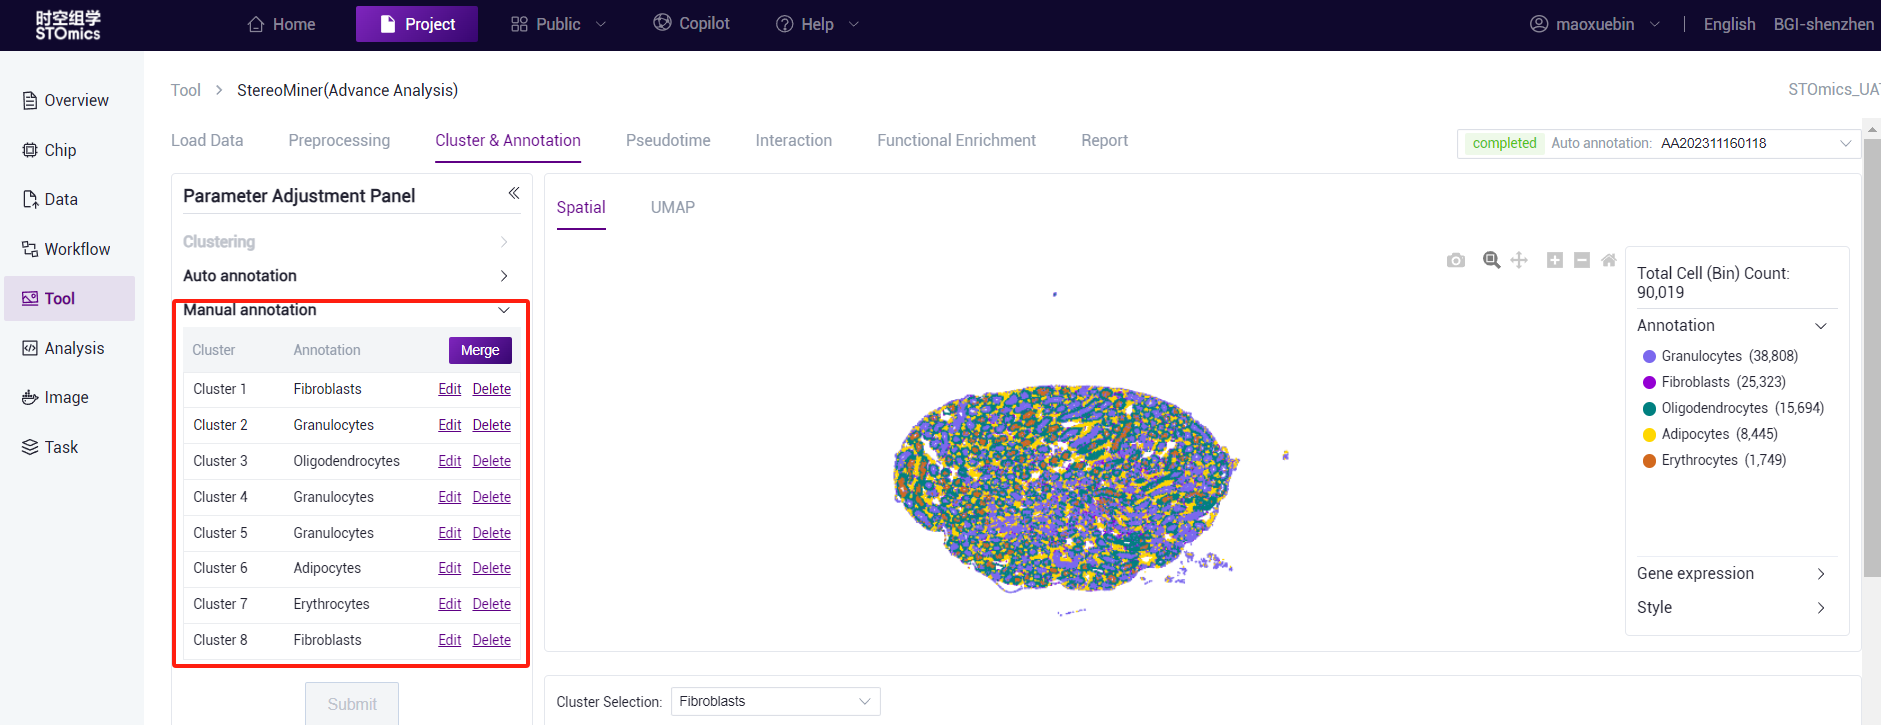
After the analysis is complete, you can view the task (task number starting with MA) on the task result page. Click the View Report button to enter the result view. View spatial and UMAP visualizations.
View the expression of different clusters.

Pseudotime analysis
Pseudotime analysis, also known as trajectory inference, refers to the development results of cell lineages obtained according to the differential expression of genes among different cell clusters, and the change trajectory of cells along a virtual time sequence is constructed. To reproduce how cells change over time.
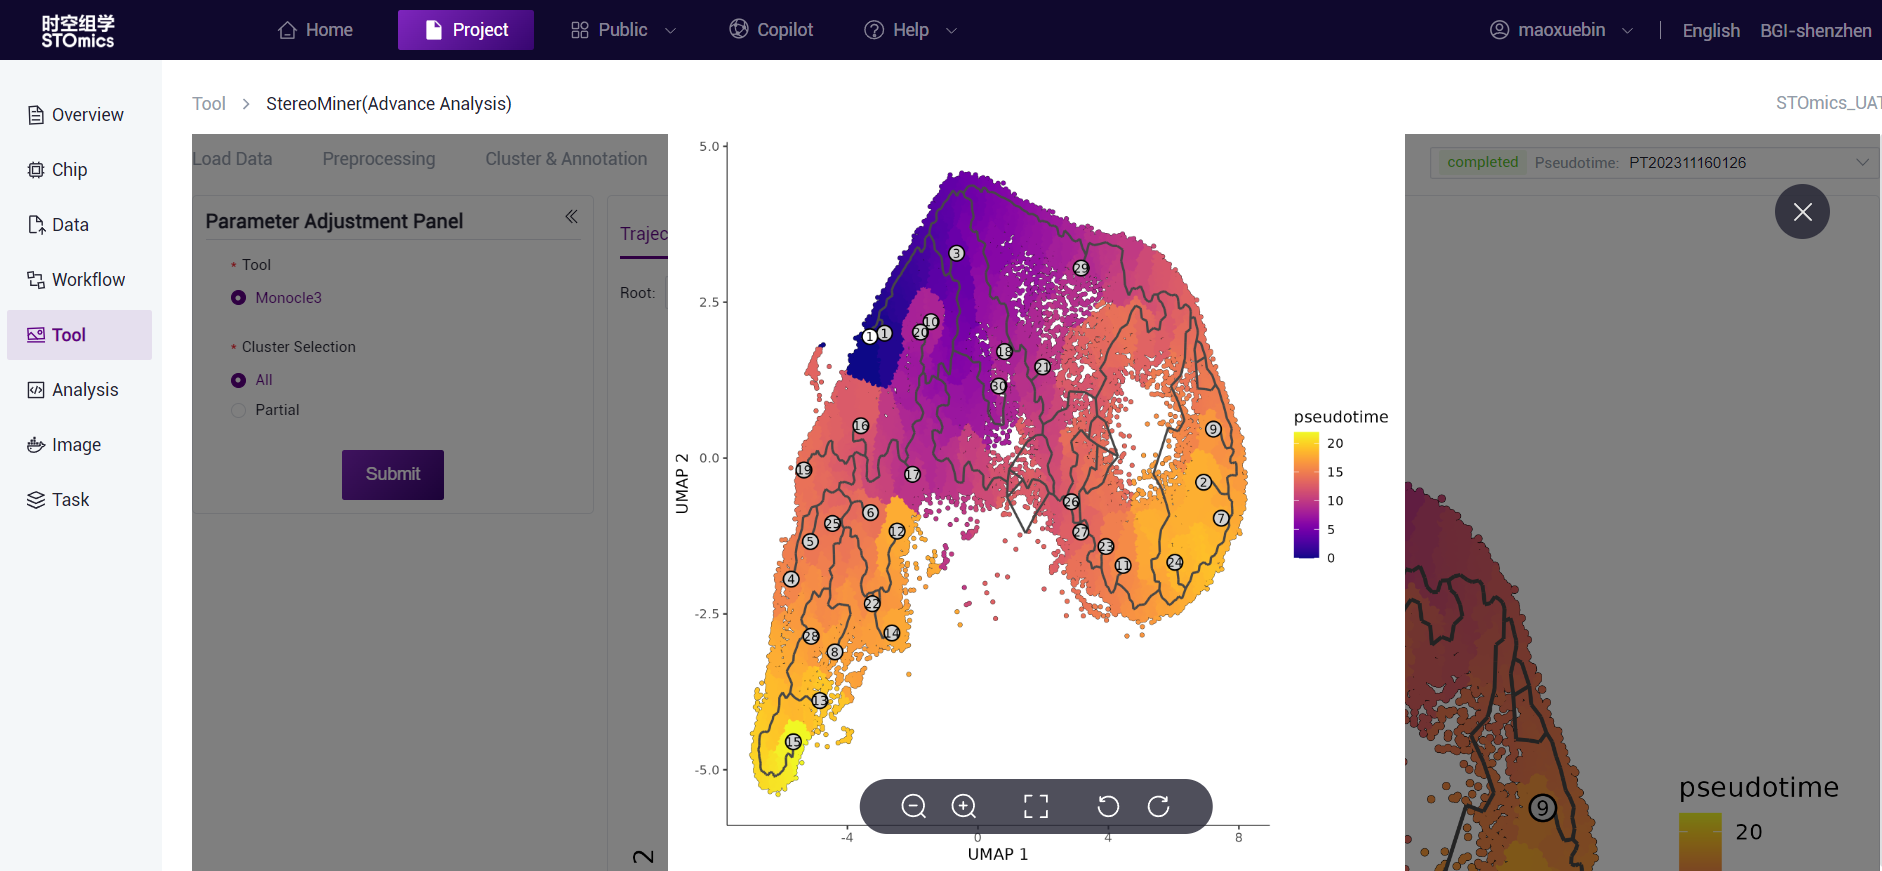
Based on the results of cell annotation, Monocle3 software was used for pseudotime analysis, and the cell annotation were visualized according to the development trajectory predicted by the software. Users can select some clusters for task delivery.
This step is expected to be 1h (1*1cm chip, 1G reads). After the analysis is completed, you can view the task (task number starting with PT) on the task result page. Click the View Report button to enter the result view. Analysis results data can also be downloaded.
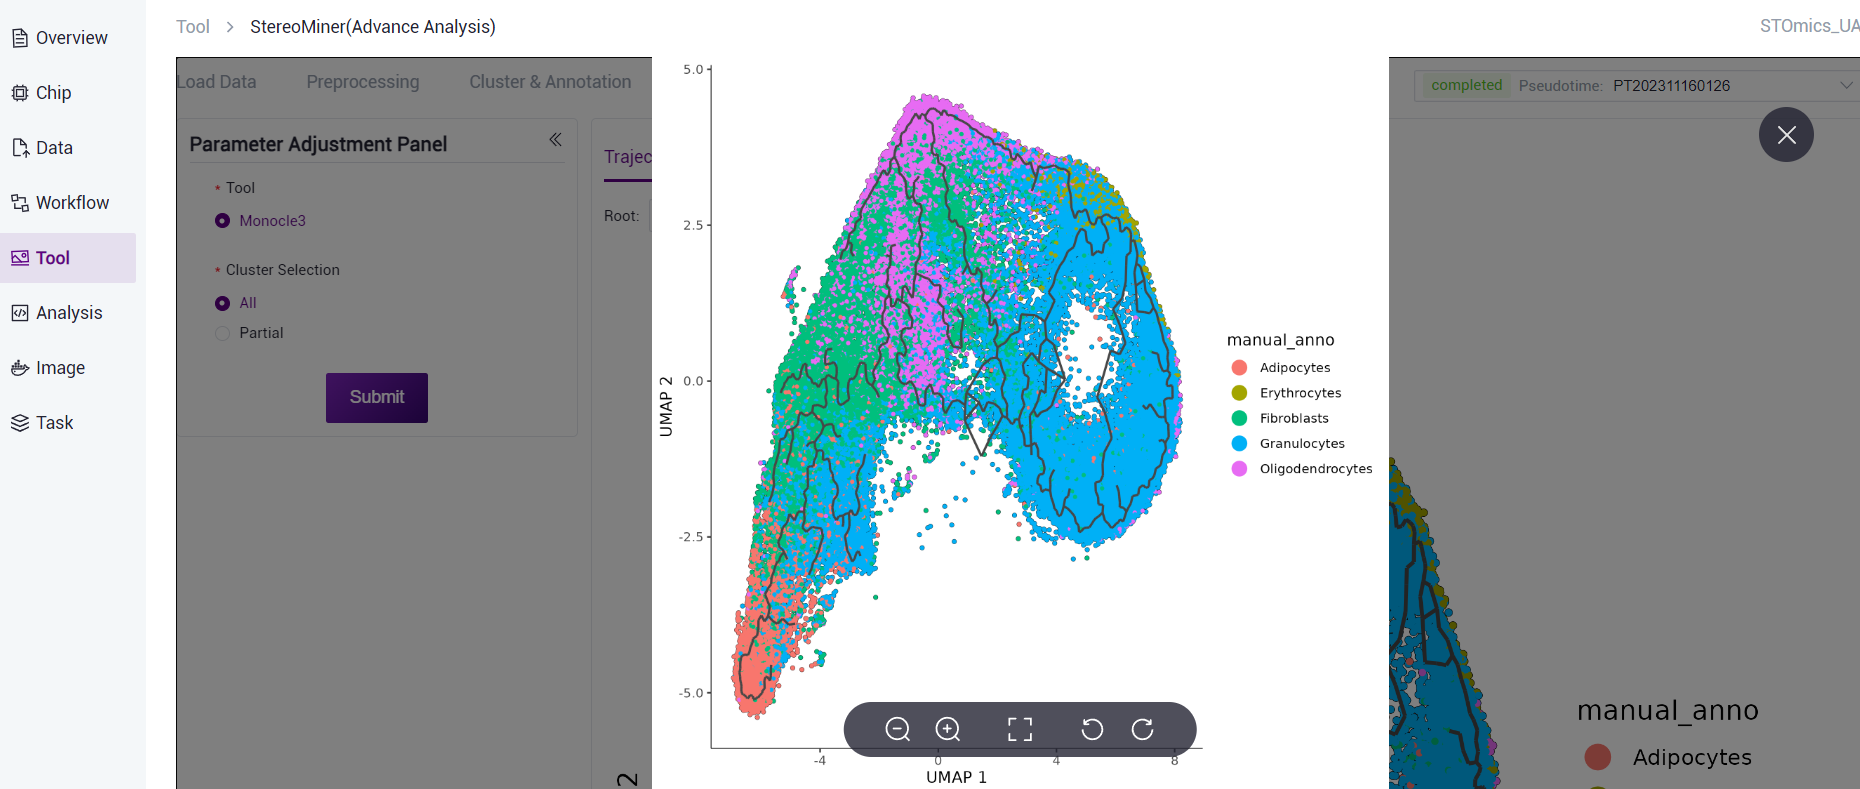
According to the node information in the cell development trajectory results, combined with the changes in gene expression in different cell annotations, Monocle3 can calculate the cells at the earliest stage of development through machine learning algorithms to achieve pseudotime analysis.
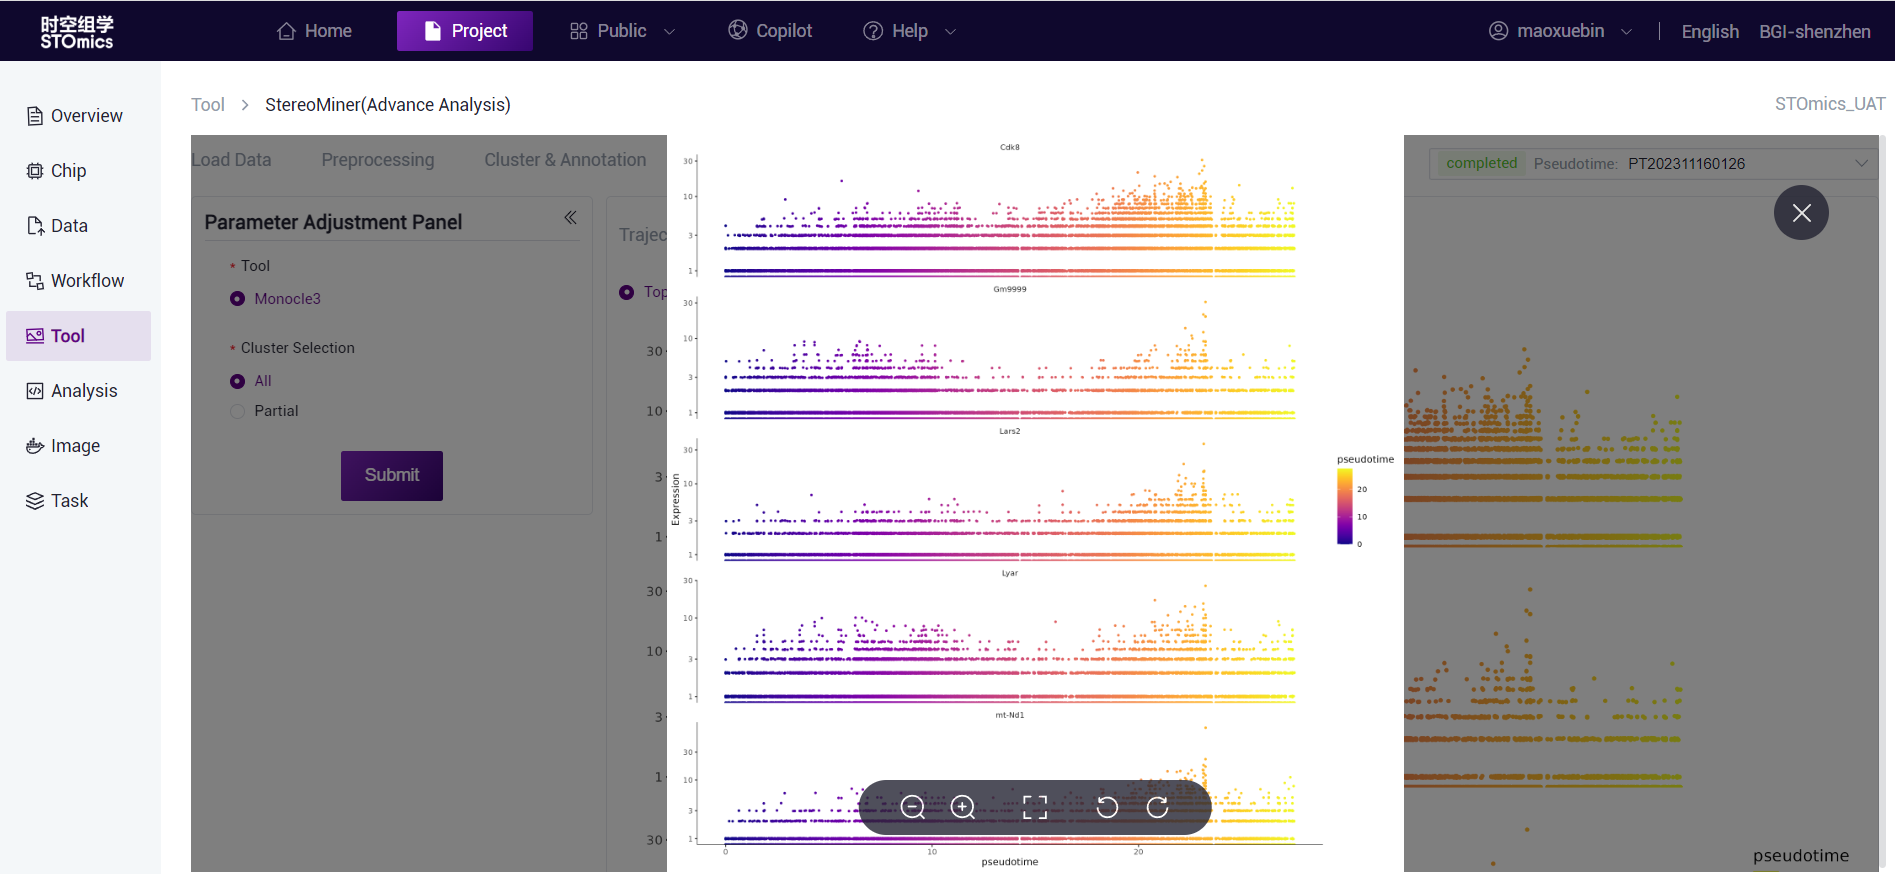
In the clustering results of different cell annotation, Top5/Top10/Top15 Marker genes calculated by Monocle3 were selected, and the pseudotime mapping of gene expression was carried out according to the obtained pseudotime results.
Cell interaction analysis
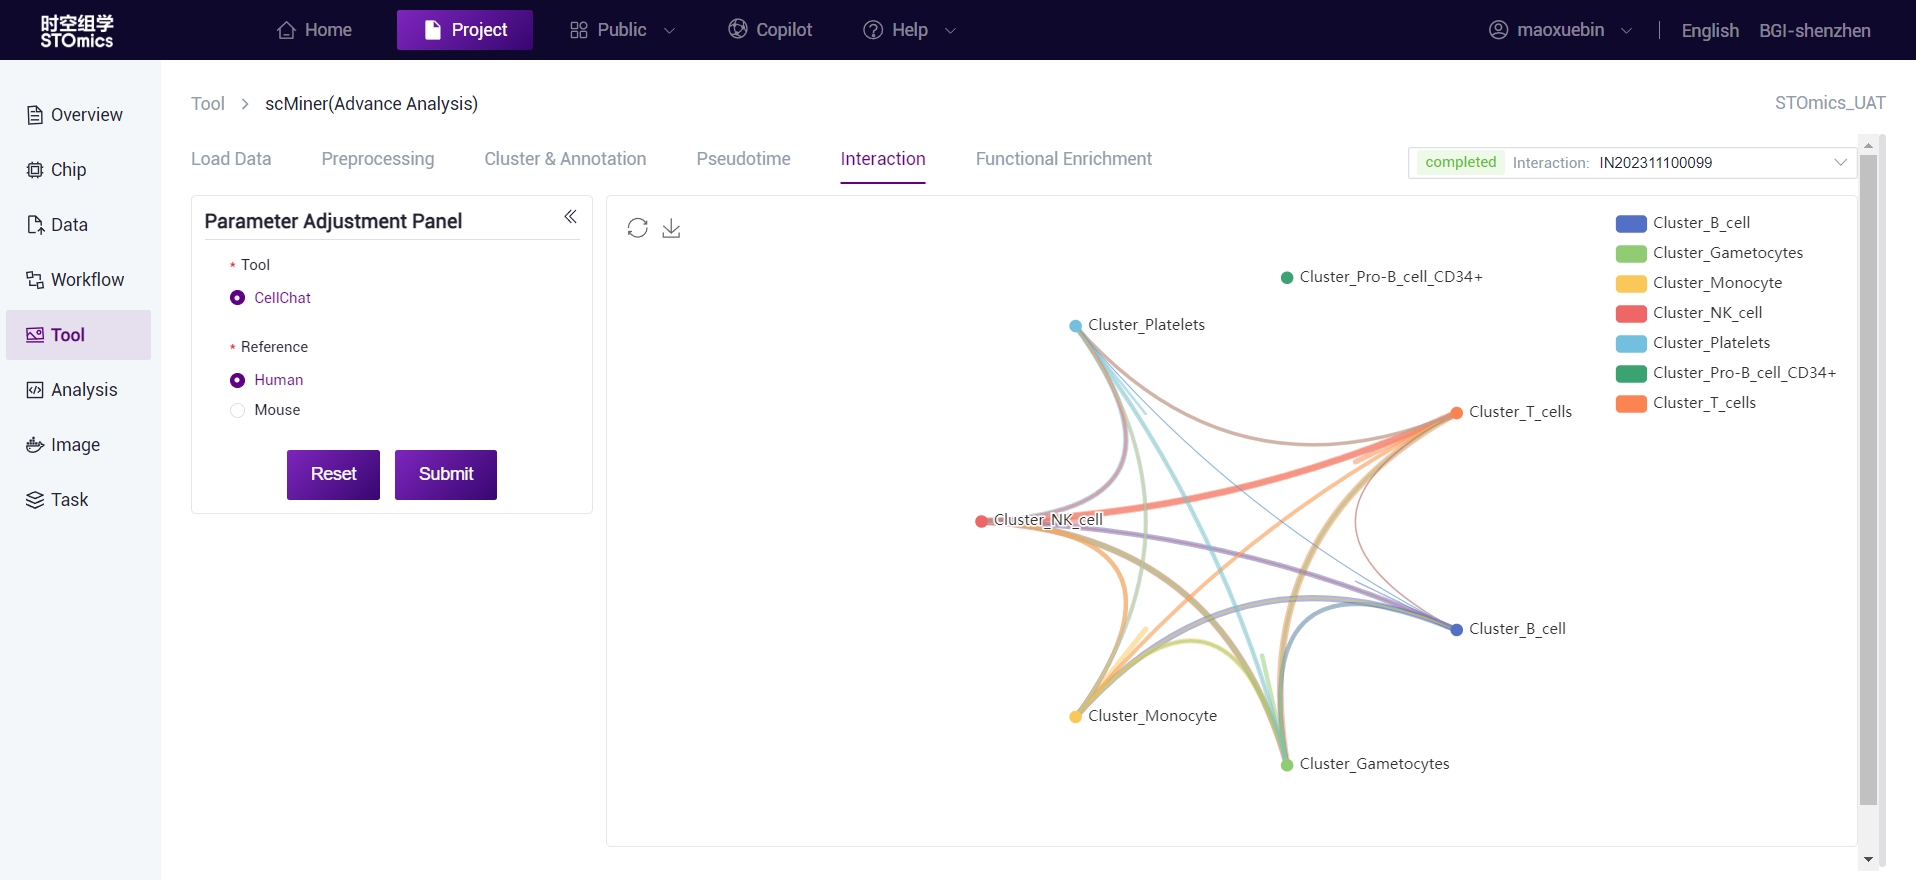
After cell annotation is completed, cell interaction analysis can be performed on annotated data, supporting CellChat and CellphoneDB analysis.
CellChat is a tool that enables quantitative inference and analysis of intercellular communication networks from single‑cell data, using network analysis and pattern recognition methods to predict the major signal inputs and outputs of cells, and cells and signals coordinate functions. The CellChatDB database integrates signal analysis information from KEGG and recent studies, which includes known ligand‑receptor complex compositions, including ligand‑receptor polymeric complexes, and several classes of coenzyme factors. CellChat tools can be used to identify ligand/receptor relationships and cell‑to‑cell communication molecules in spatial transcriptome data, and to study the interaction and communication networks between different cell types.
CellPhoneDB is a database of ligands and their interactions. Different from other databases, CellPhoneDB considers the subunit structure of ligands and accurately expresses heteromer complexes.
This step is expected to take 3 hours (1*1cm chip, 1G reads). After the analysis is completed, you can view the task (task number starting with IN) on the task result page. Click the View Report button to view the result. Analysis results data can also be downloaded.
Functional enrichment
After cell annotation is completed, functional enrichment analysis can be performed based on the annotated data. The functional enrichment analysis of GO (Gene Ontology) and KEGG (Kyoto Encyclopedia of Genes and Genomes) for each cell type was performed using clusterProfiler software. This step is expected to be 0.5h (1*1cm chip, 1G reads).
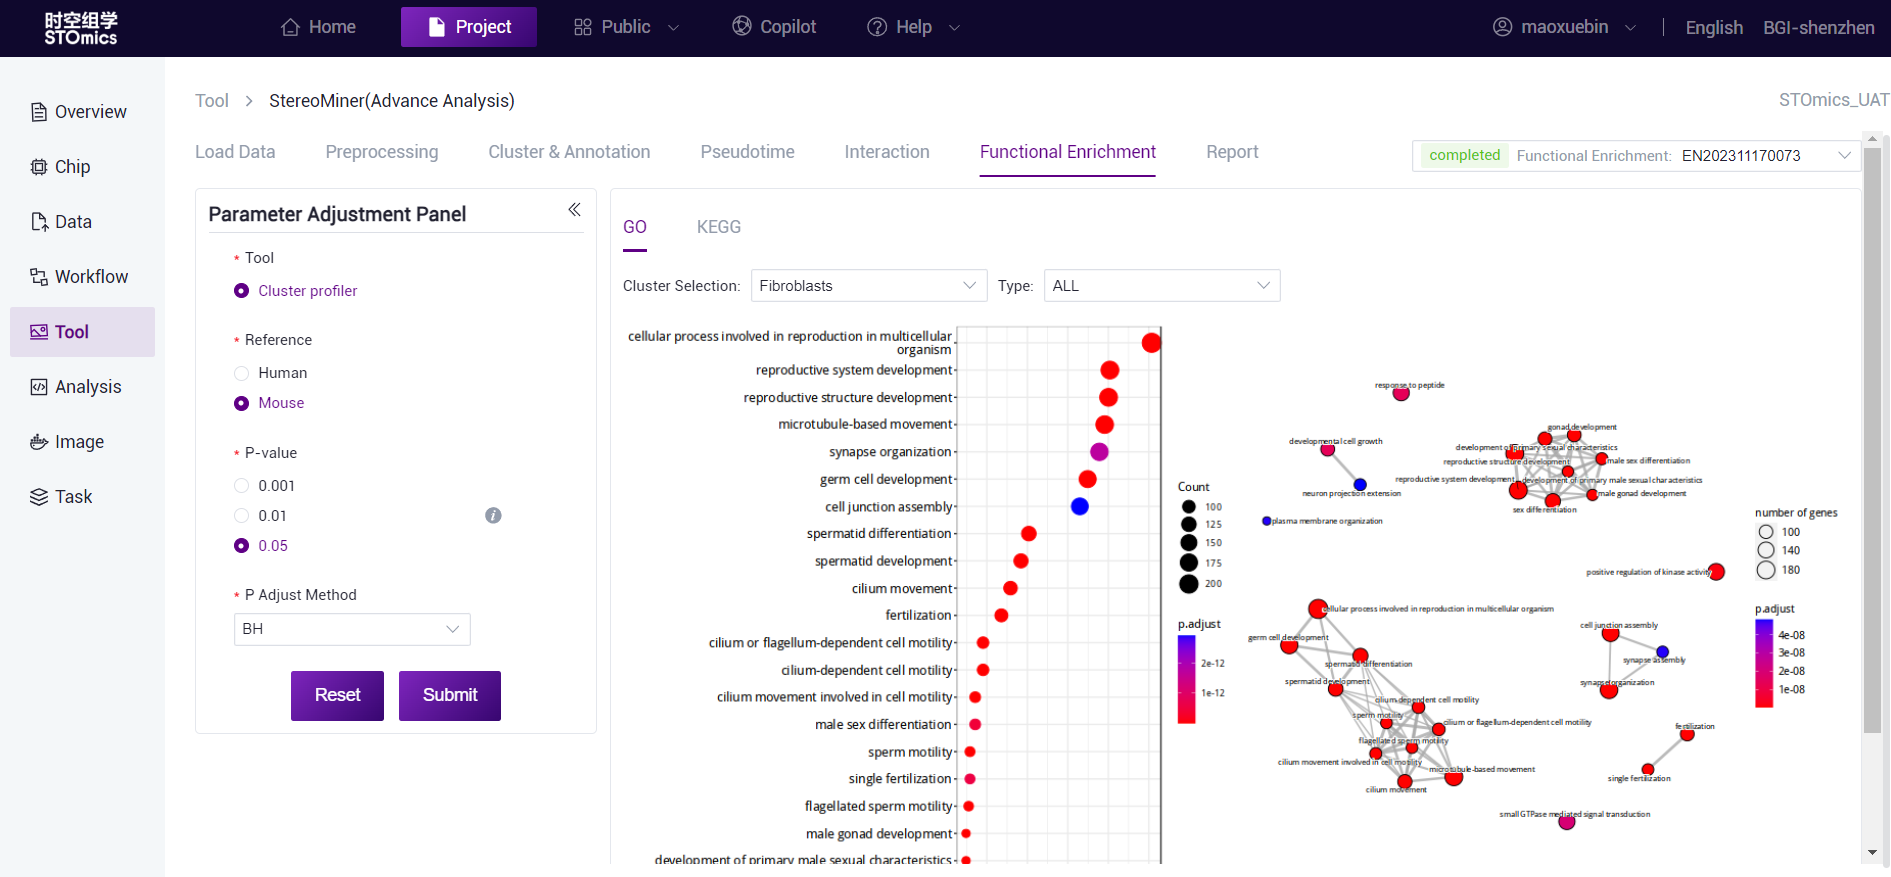
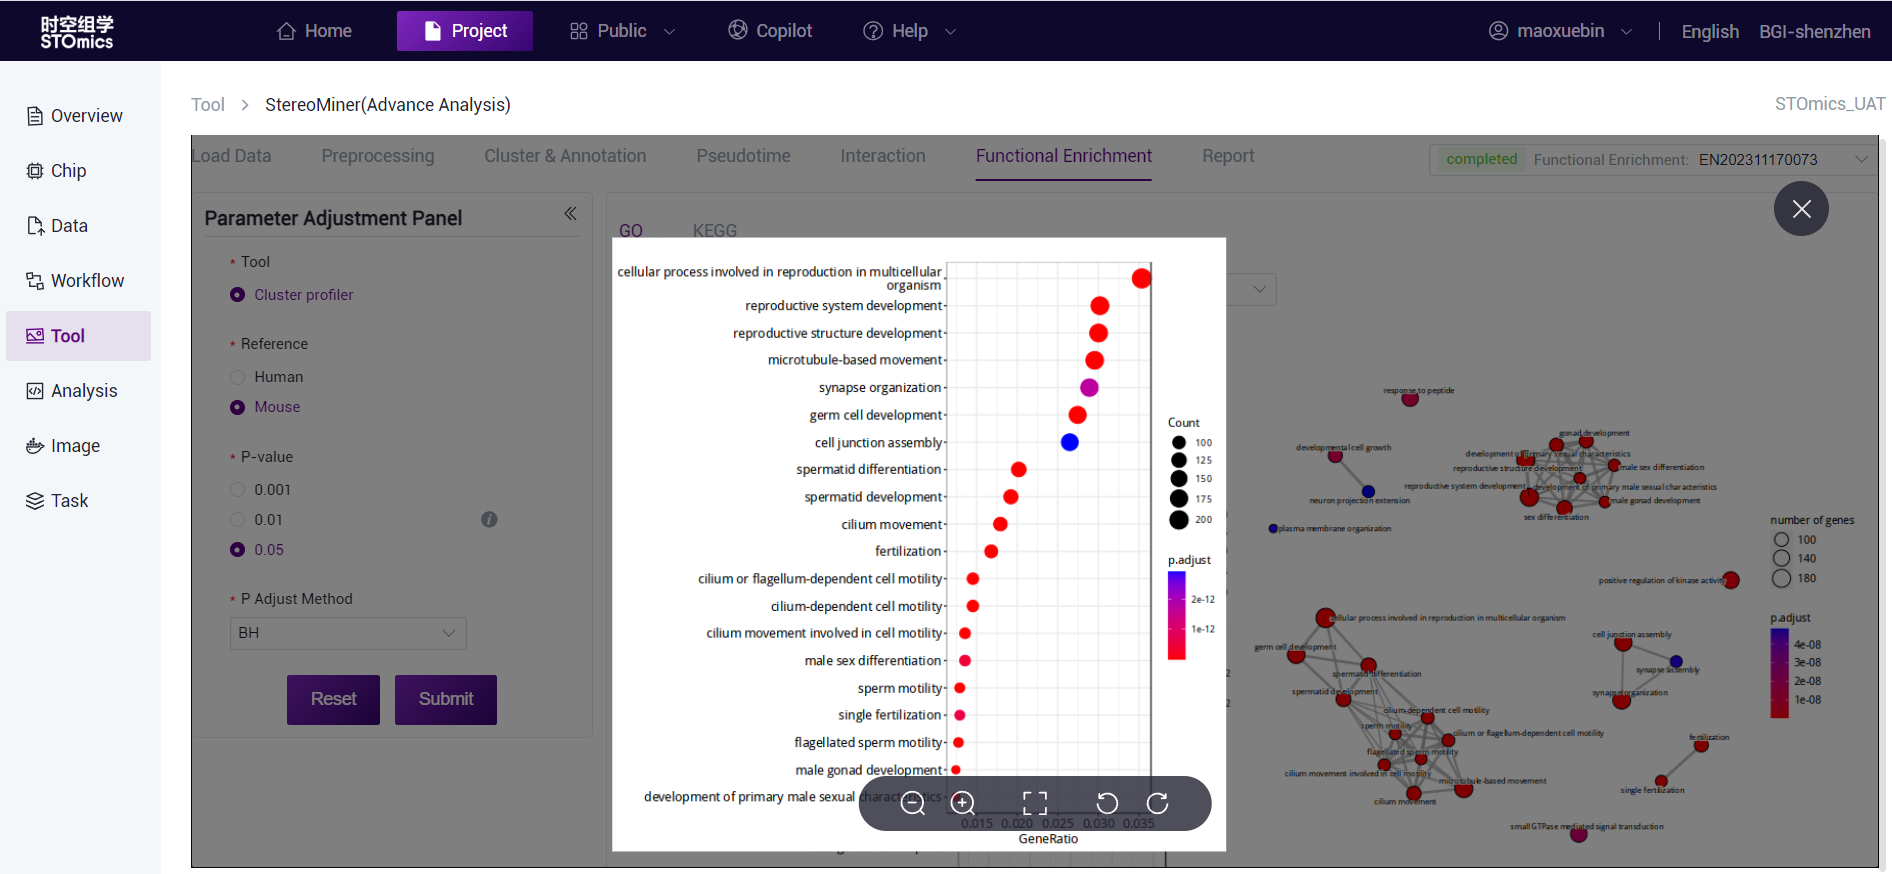
The horizontal axis is the proportion of enriched genes, and the vertical axis is the enriched GO term. The color corresponds to the P‑value, and the redder indicates the more significant enrichment effect.
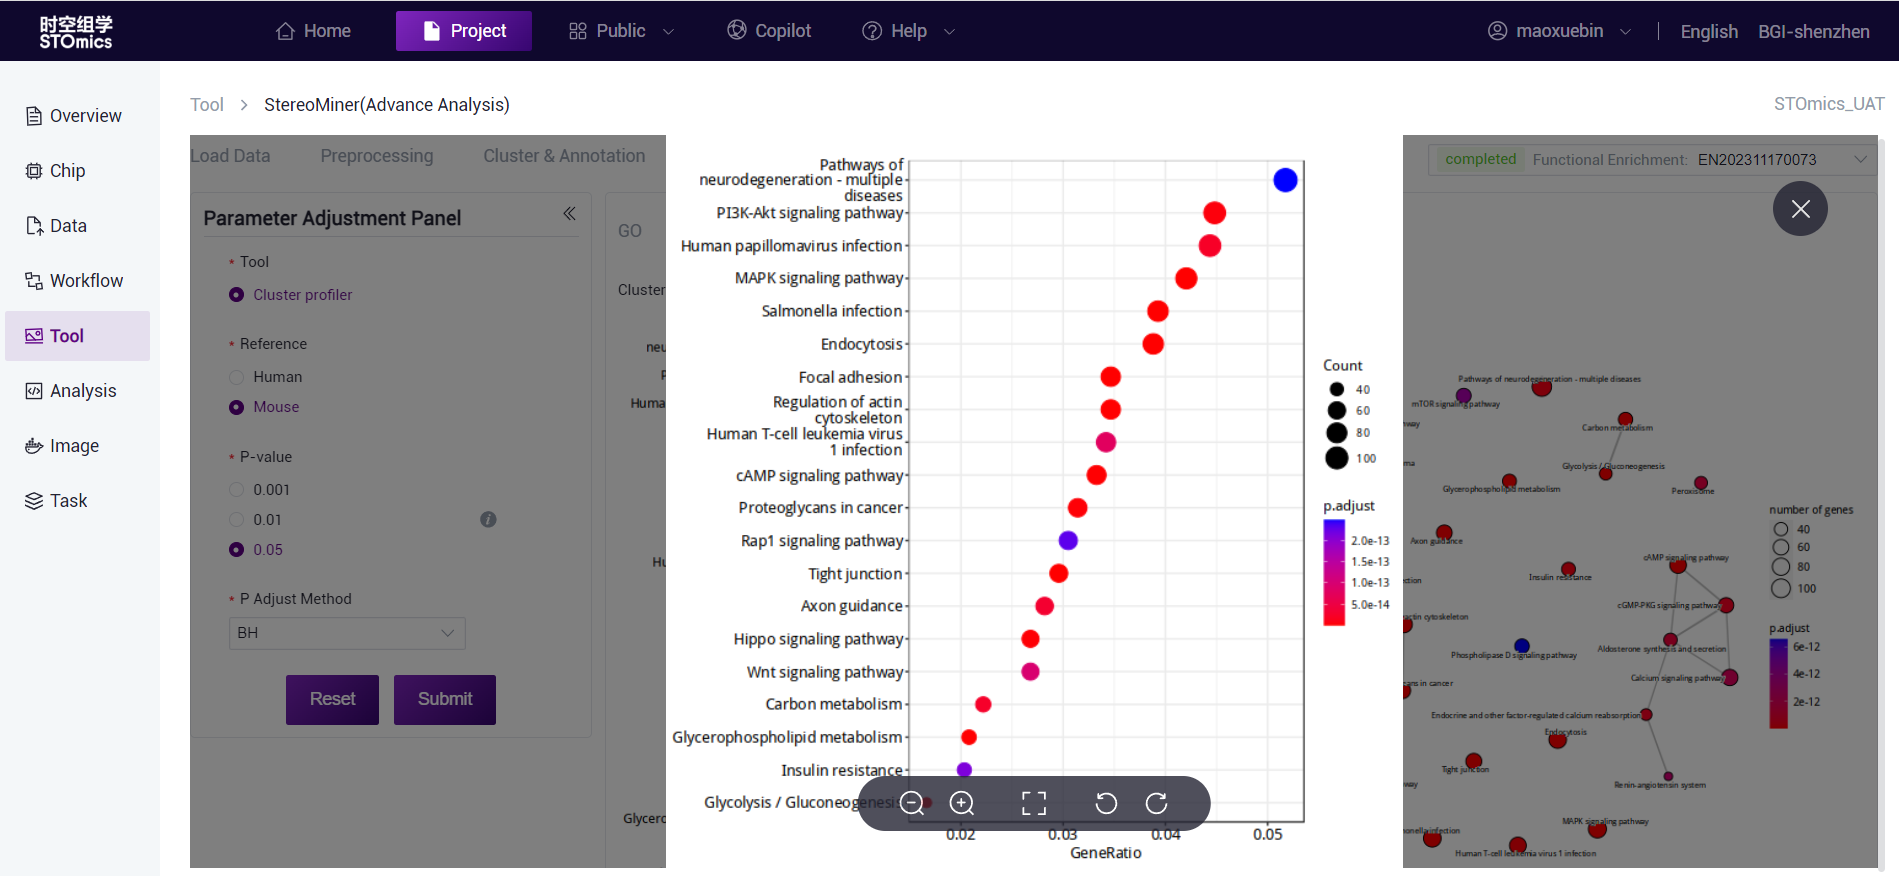
The horizontal axis is the proportion of enriched genes, and the vertical axis is the enriched KEGG Pathway. The color corresponds to the P‑value, and the redder indicates the more significant enrichment effect.
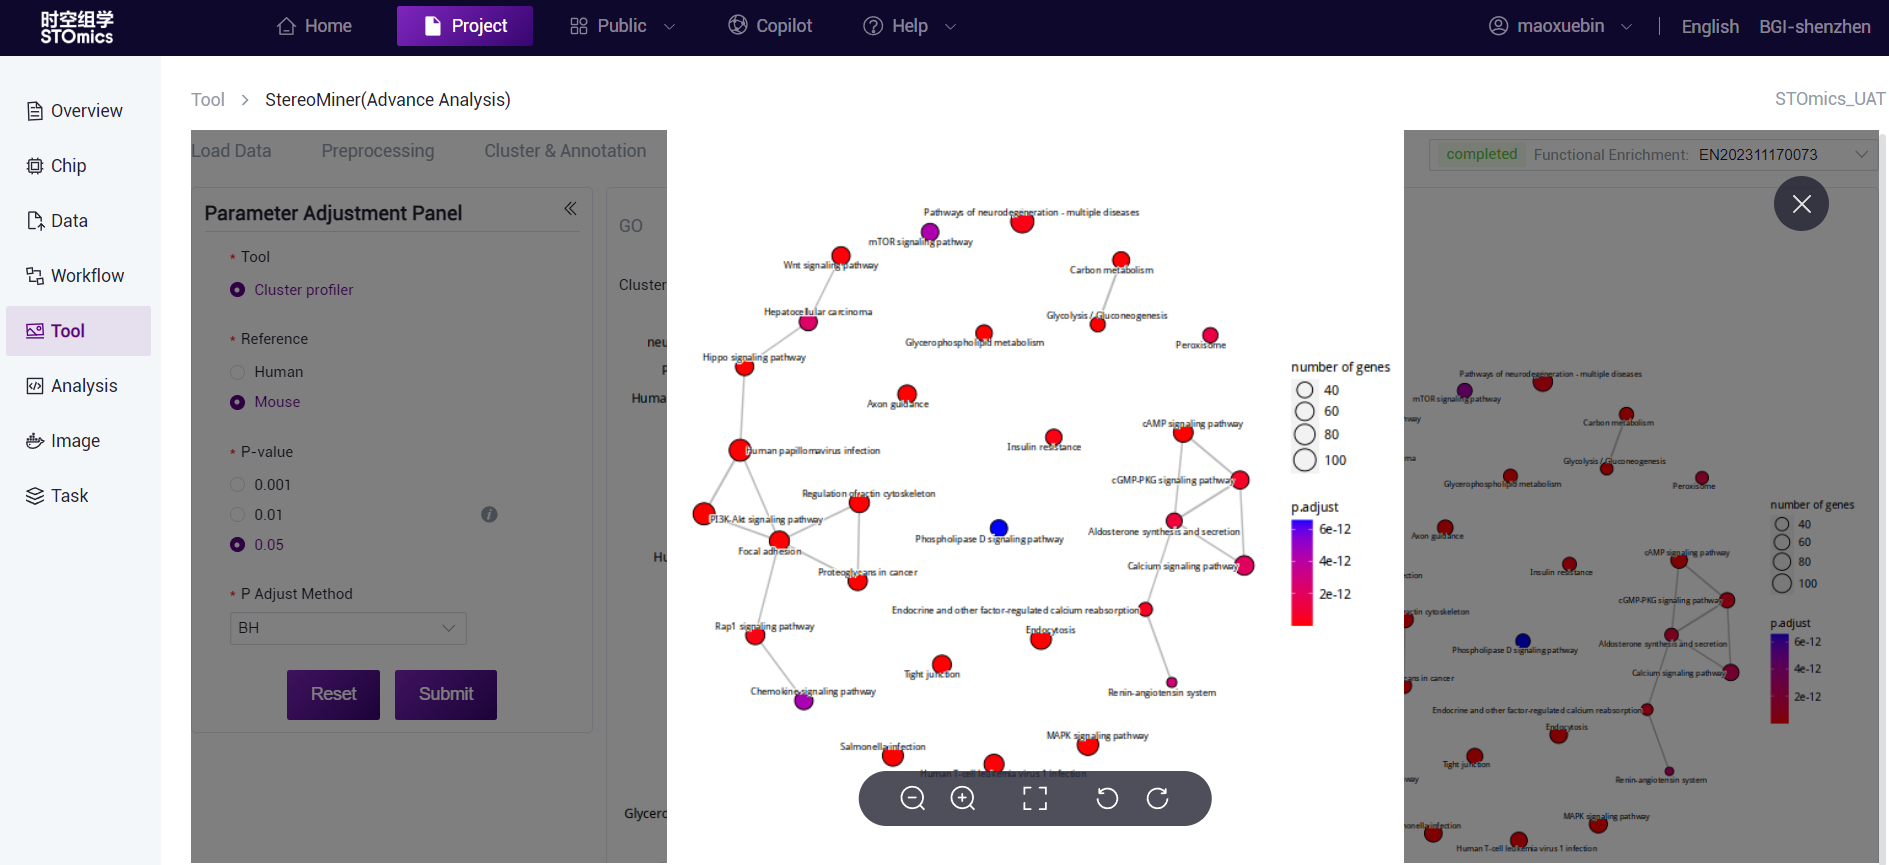
The dots are the enriched GO term, the dot size represents the gene number, the dot color represents the P‑value, and the redder indicates the more significant enrichment effect. The thickness of the connecting line indicates the number of genes shared between the two GO terms.
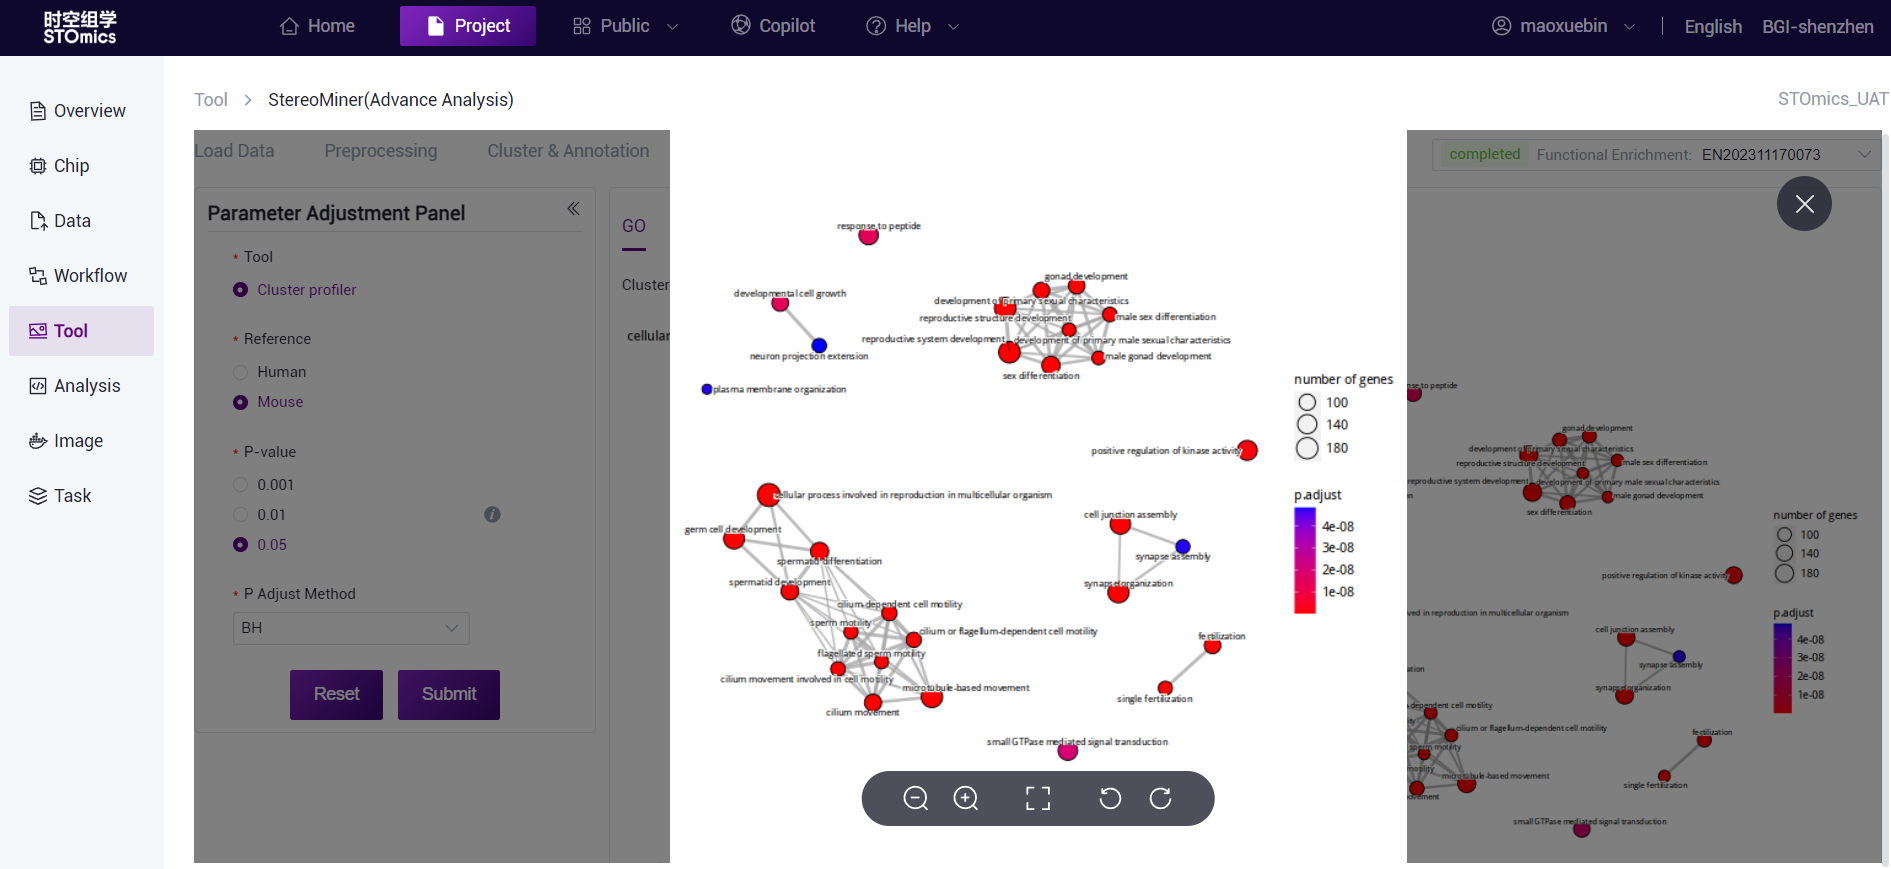
The dots are the enriched KEGG Pathway, the size of the dots represents the number of genes, and the color of the dots represents the P‑value. the redder indicates the more significant enrichment effect. The thickness of the connecting lines indicates the number of genes shared between the two GO terms.
Analysis parameter description
For details, plese refer to:
Tripartite card contents:
https://alidocs.dingtalk.com/i/p/Db6Vz6vdvj1zZ9NAb6Vz6elRYVkBpGZ9.
Report generation
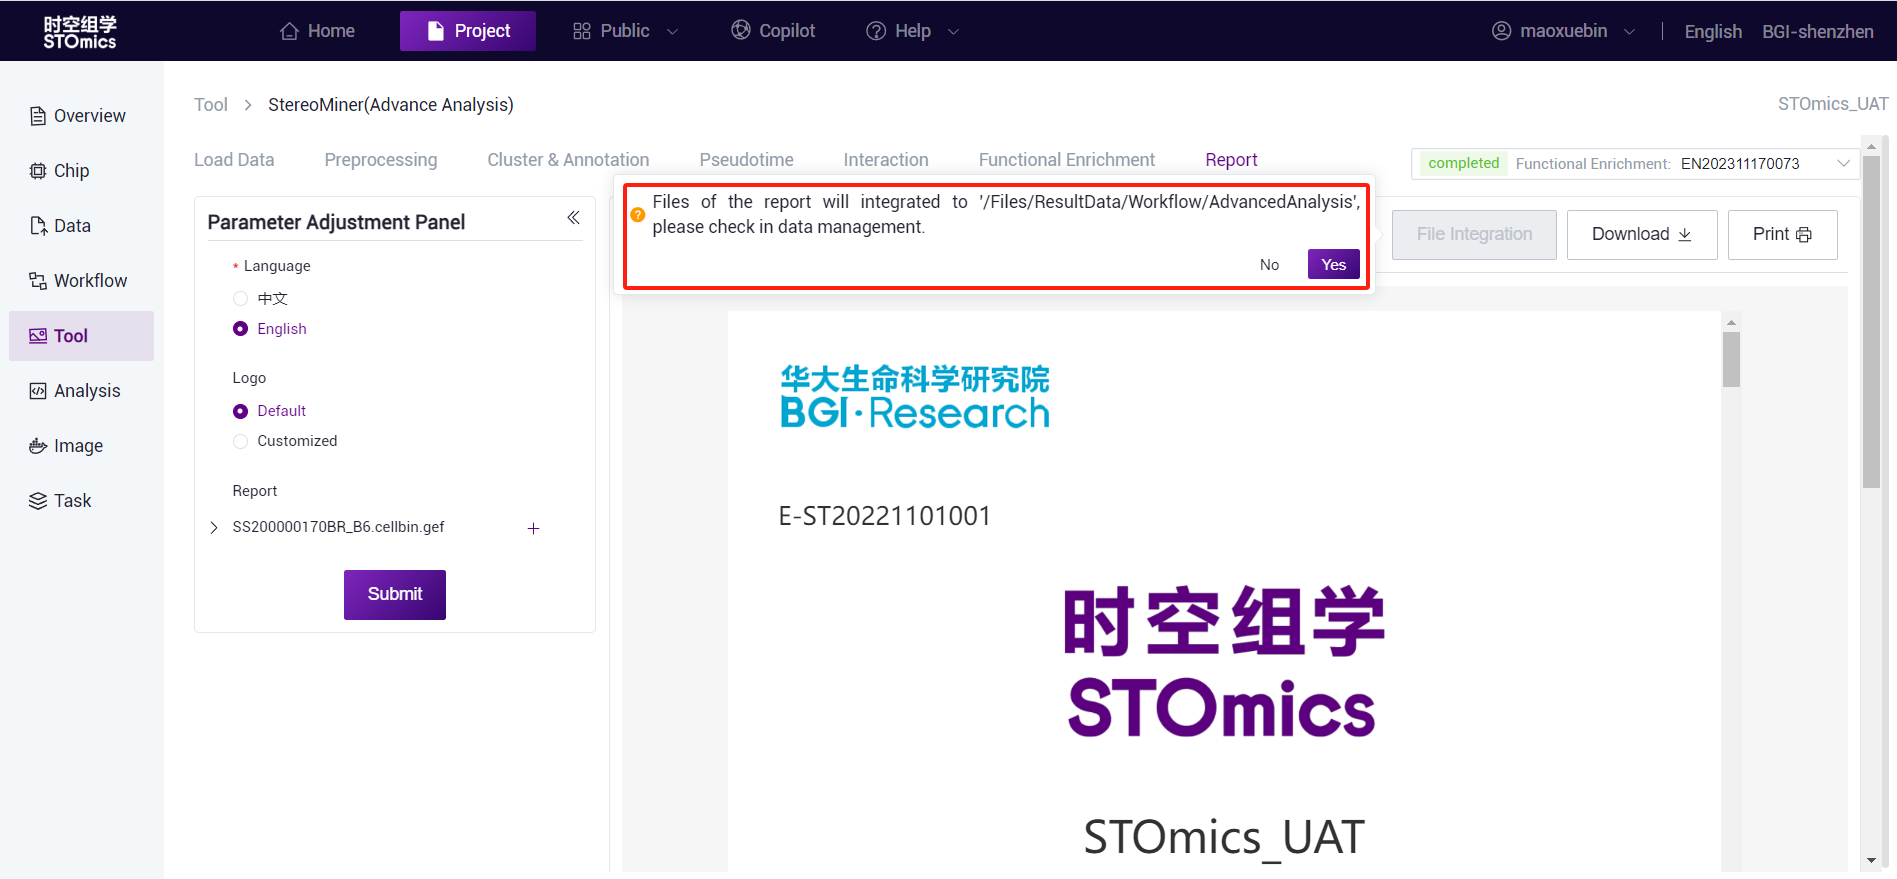
Language optional
Report modules can be selected, corresponding to the submodules under Analysis Result ‑> 4 Data Analysis in the report directory. Select all by default.
Note
If the gef file is not produced by the platform standard process, there is no data in the "Quality control Data Result Statistics" section.
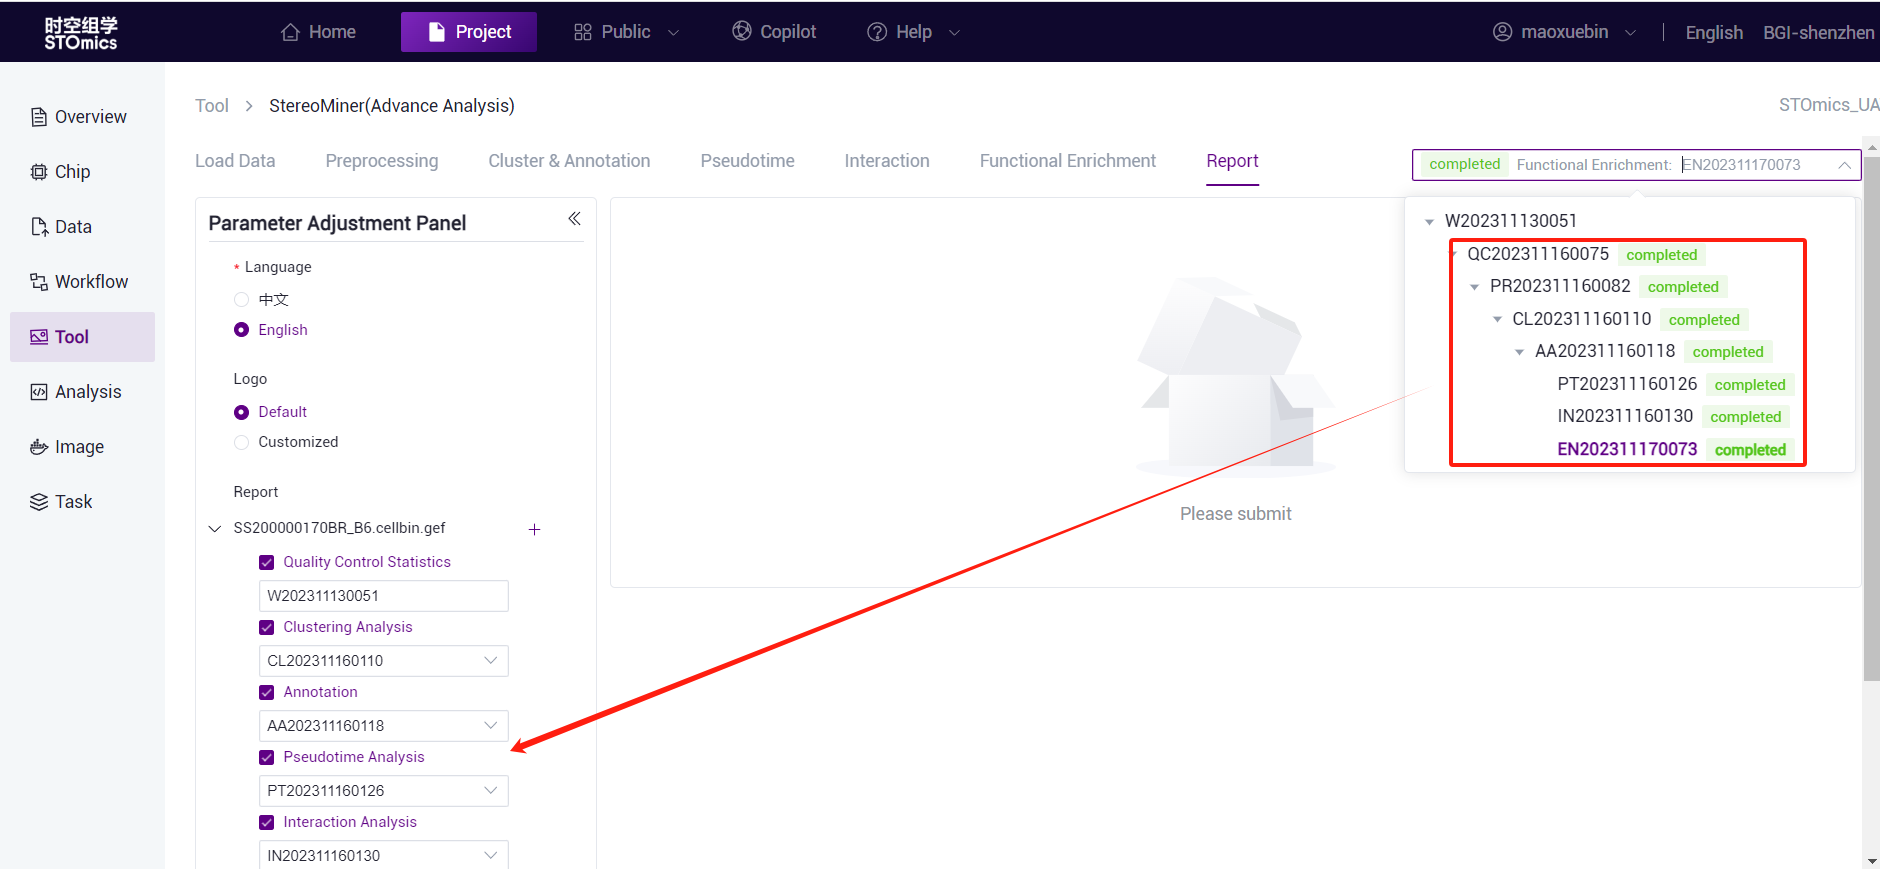
- You can select the task data required for report generation. The system automatically fills in the associated task data based on the current task at the time of jump. If the upper‑level task is changed, the drop‑down list of lower‑level tasks is automatically filtered.
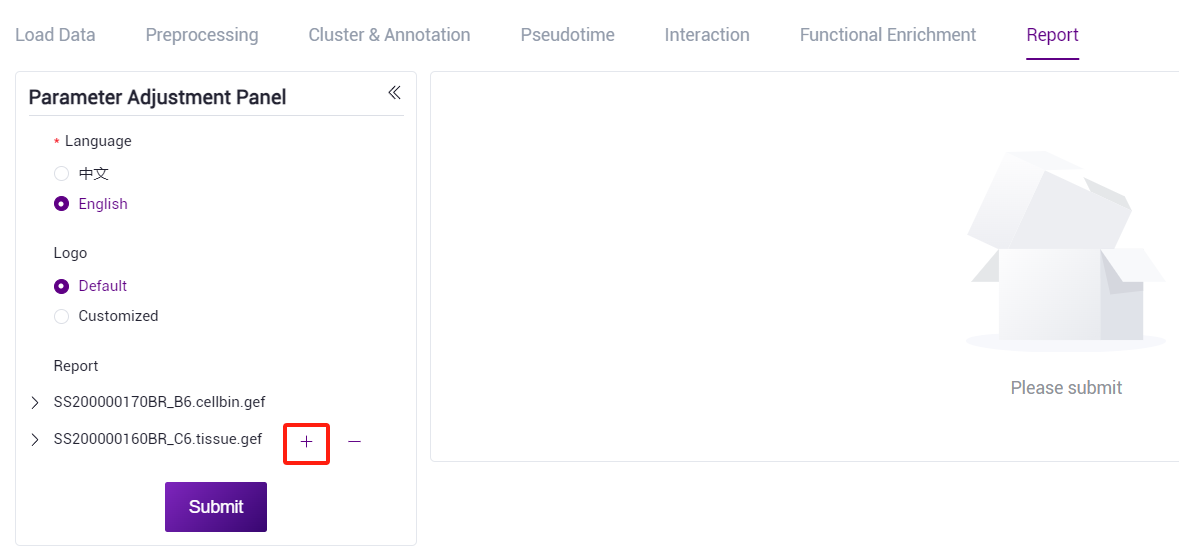
Select multiple chips to generate reports at the same time. The steps are as follows:
When you enter the report module from the current task, the current chip file is automatically selected and the task number is filled.
Click the "+" sign to select the new file.
- Filter files by file type, task number, SN number, sample number, and creator. You can view the task number in the advanced analysis task list corresponding to the chip. (Note: Only files that have run historical tasks can be selected.)
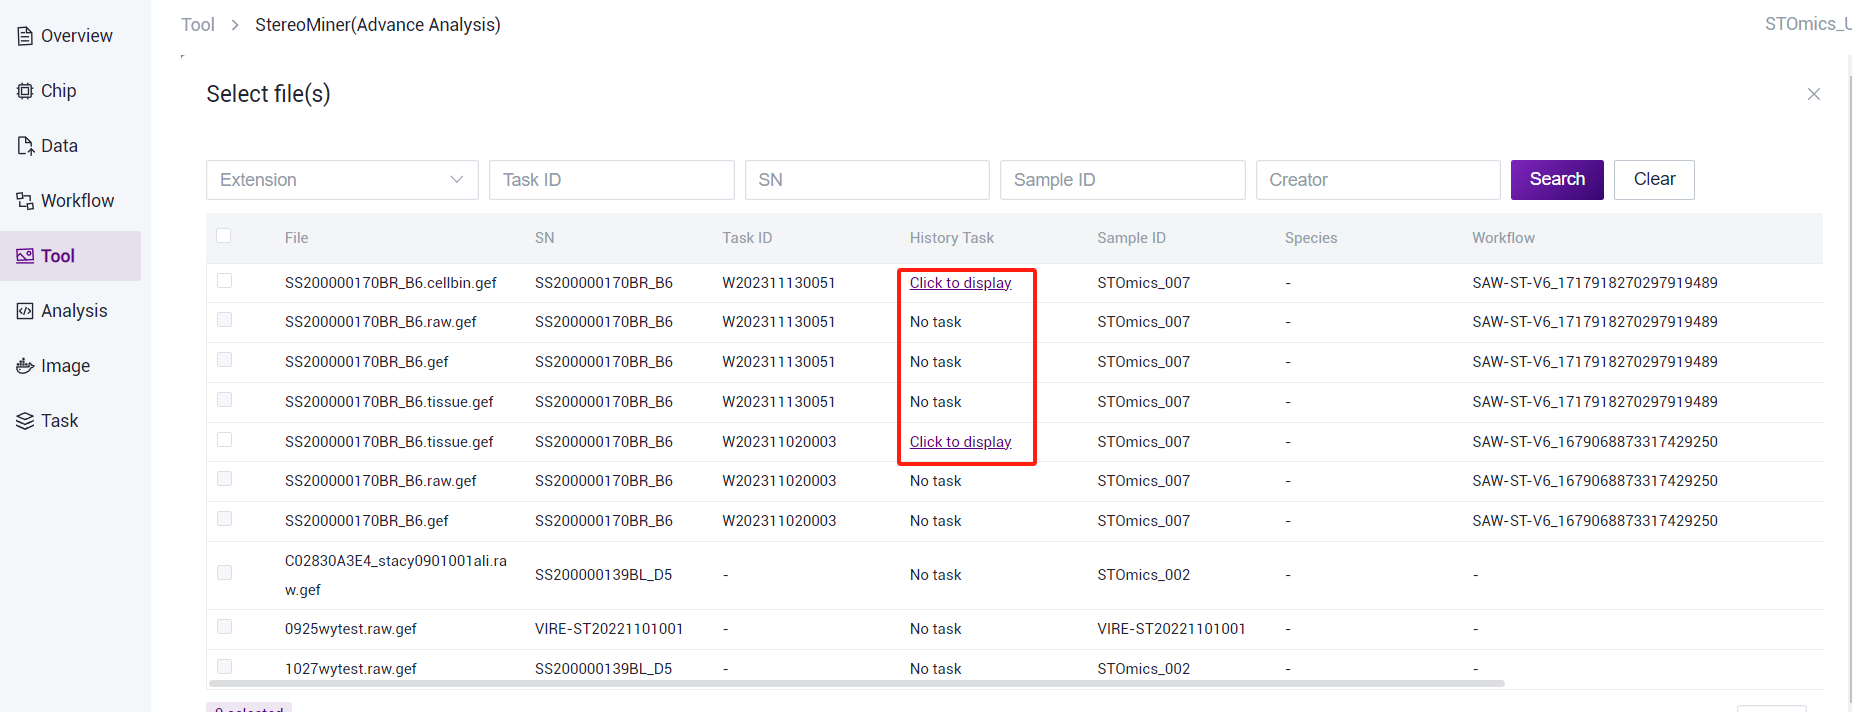
taskid
Note: Make sure that multiple chips contain the same task modules, otherwise the report will not be generated.
Reports can be downloaded (.html files) and printed (.pdf files).
Note
Page numbers and table of contents are generated only when printed as pdf.
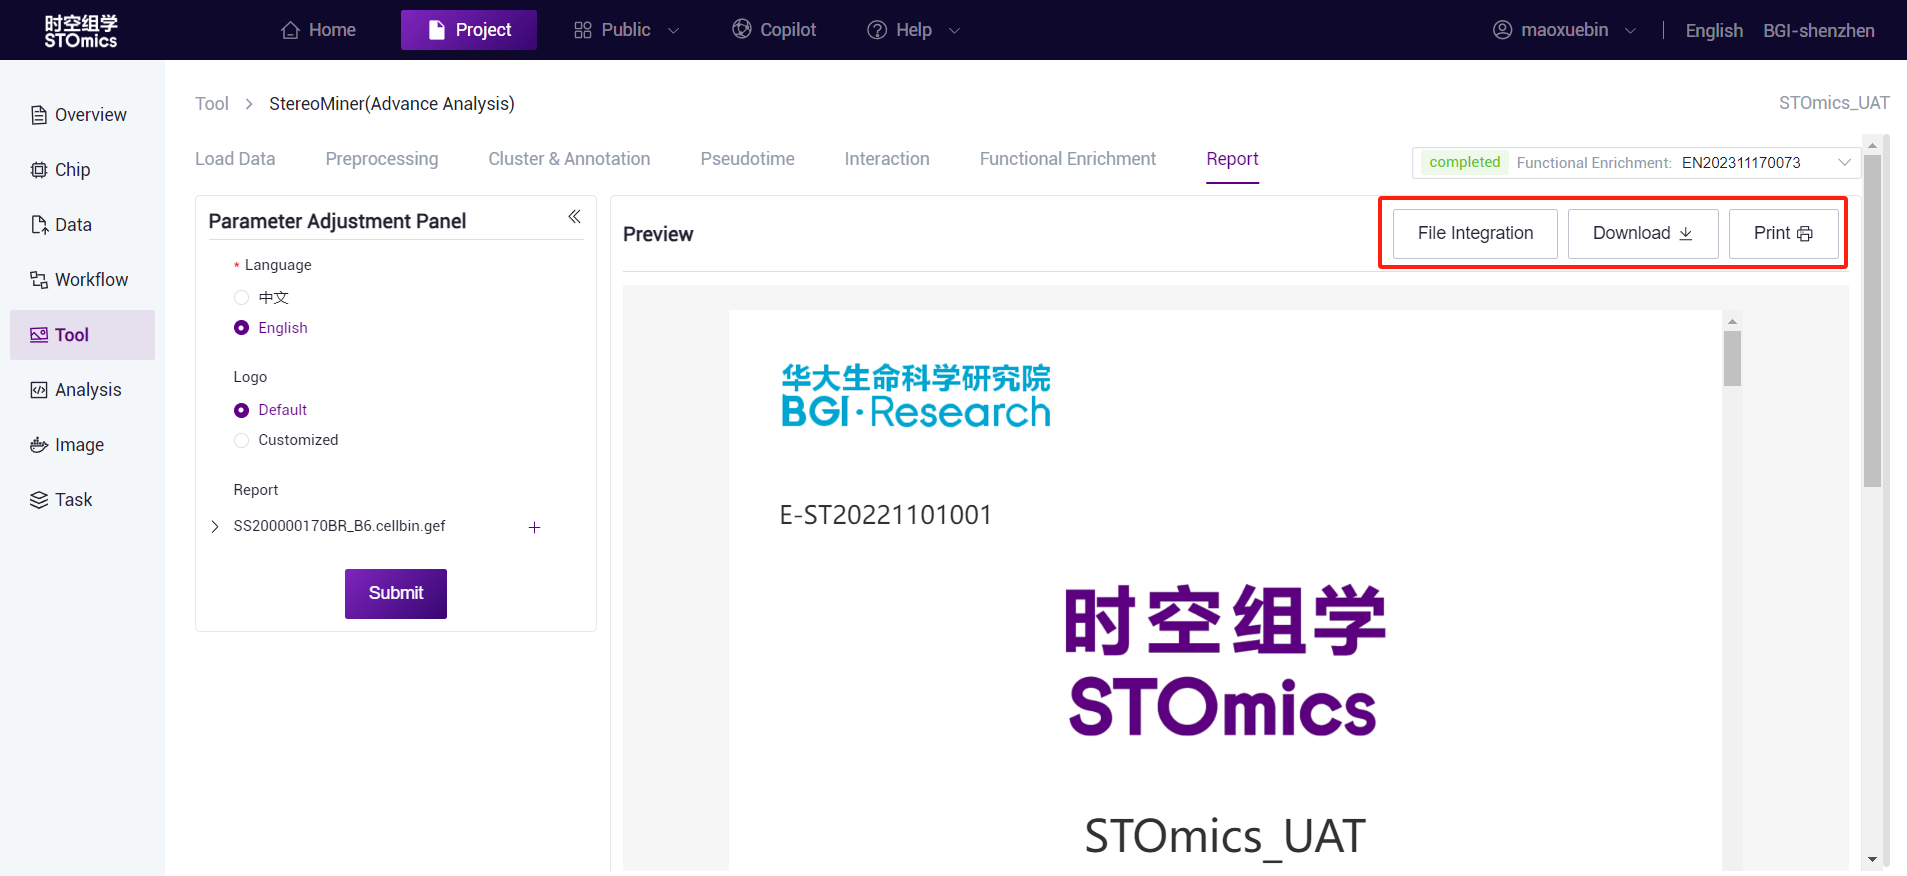
- Support "File Integration" function: all the results generated by the selected report module (except h5ad file) will be integrated into the following path of the data management module, which is convenient for users to quickly organize and deliver.