Quickstart
Quickstart
To introduce the main features of DCS Cloud, we will use Stereo-seq data analysis using SAW-ST-V7.
Create a Project
The project is the core concept of DCS Cloud; each project is an independent, controllable set of biological data. Users can add, manage, analyze, and share multi‑omics data within a project, ensuring traceability of analysis, reproducibility of results, knowledge sharing, and project collaboration. Therefore, the first step in analyzing on DCS Cloud is to create a project.
New Project
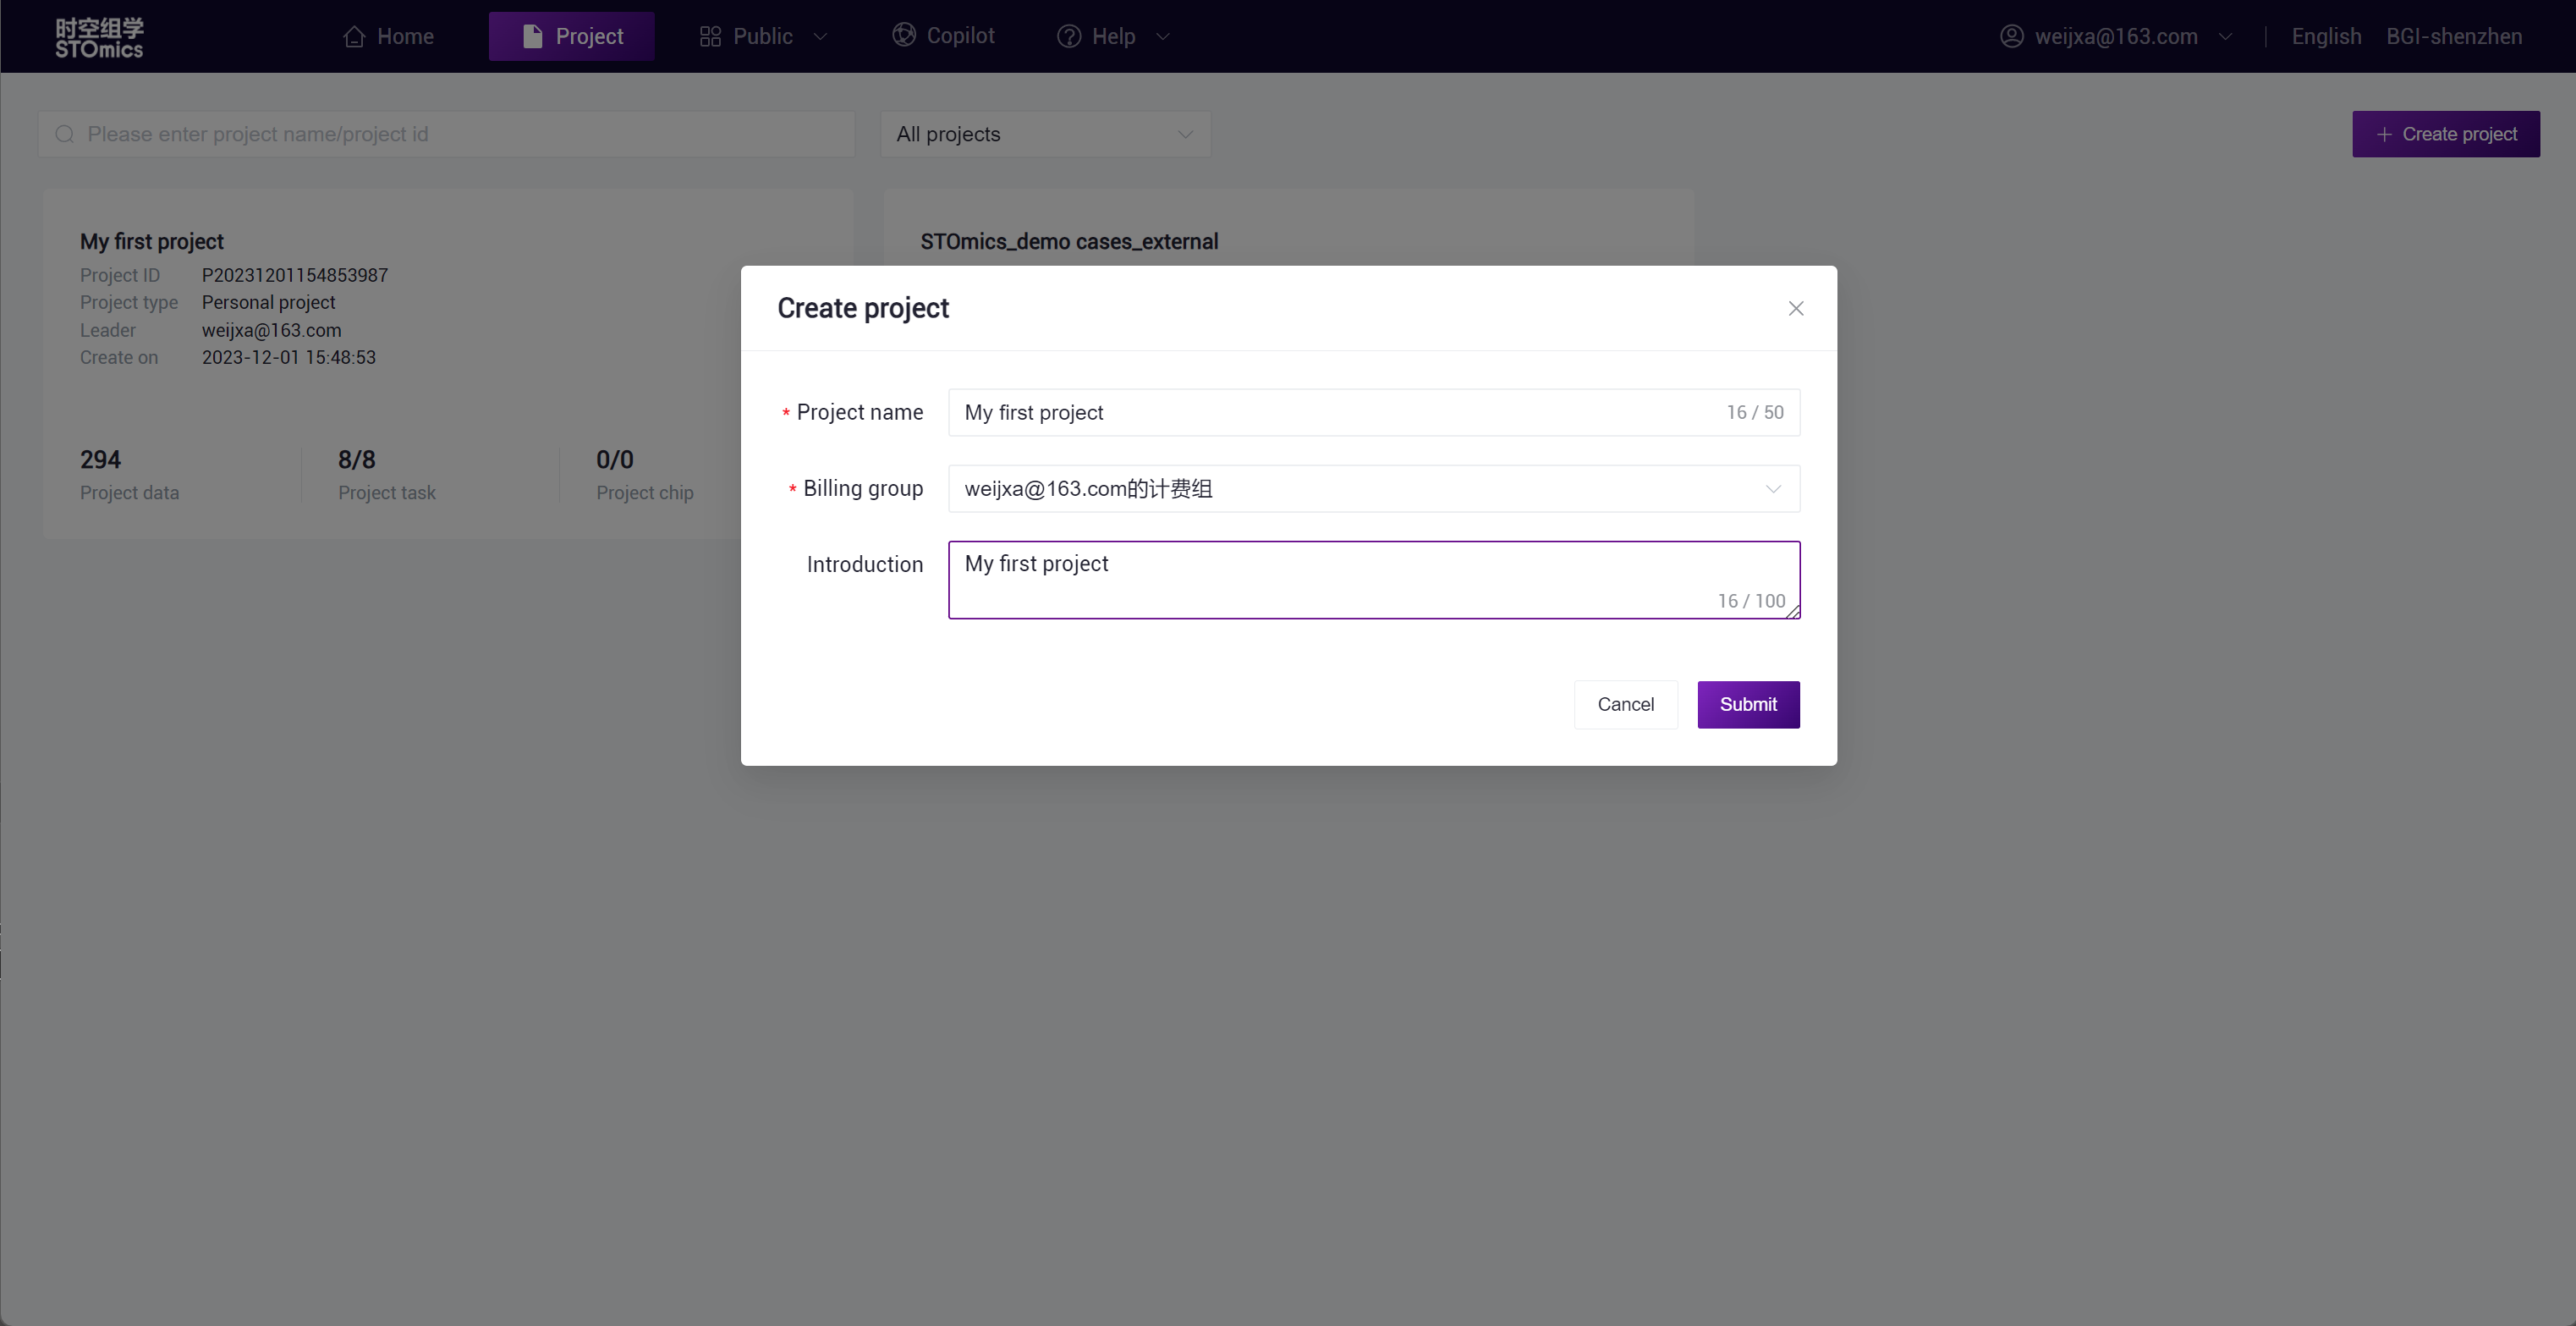
On the Project Management home page, click the "Create Project" button in the upper right corner. In the pop‑up dialog, enter the project name, select the billing group, and fill in the project summary, among other information. Click "Submit" to complete the creation of the project.
Invite Members
After the project is created, you can go to Overview-Project Members to invite members to join the project.
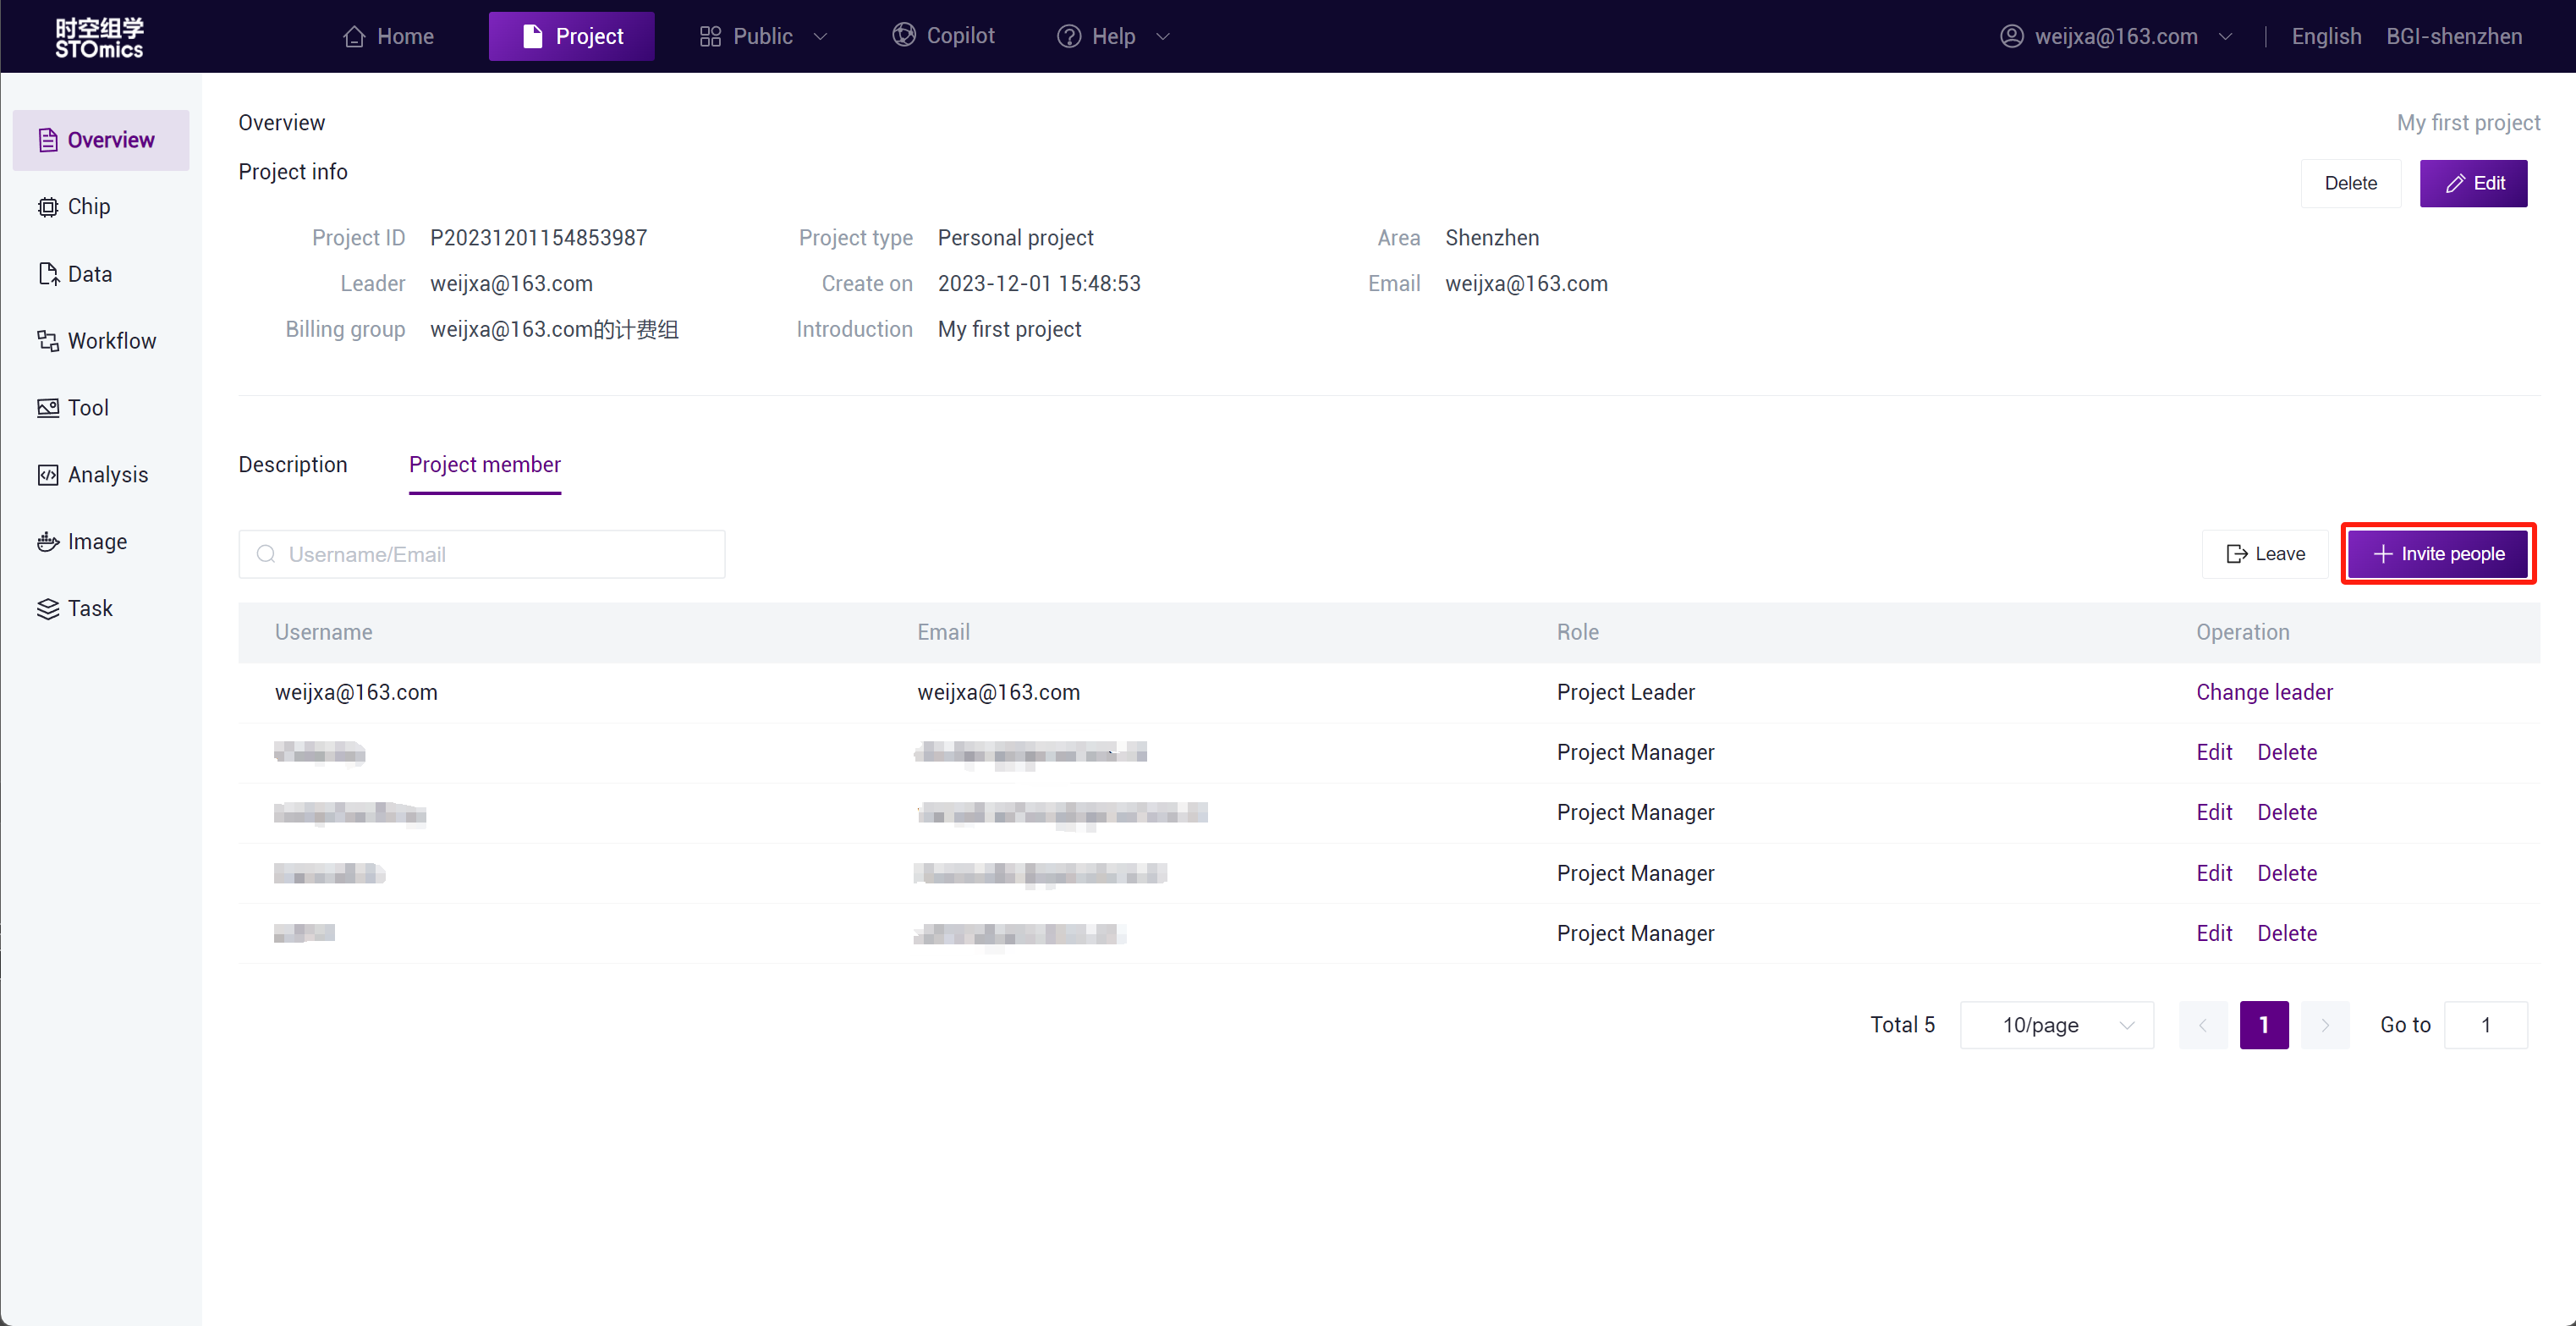
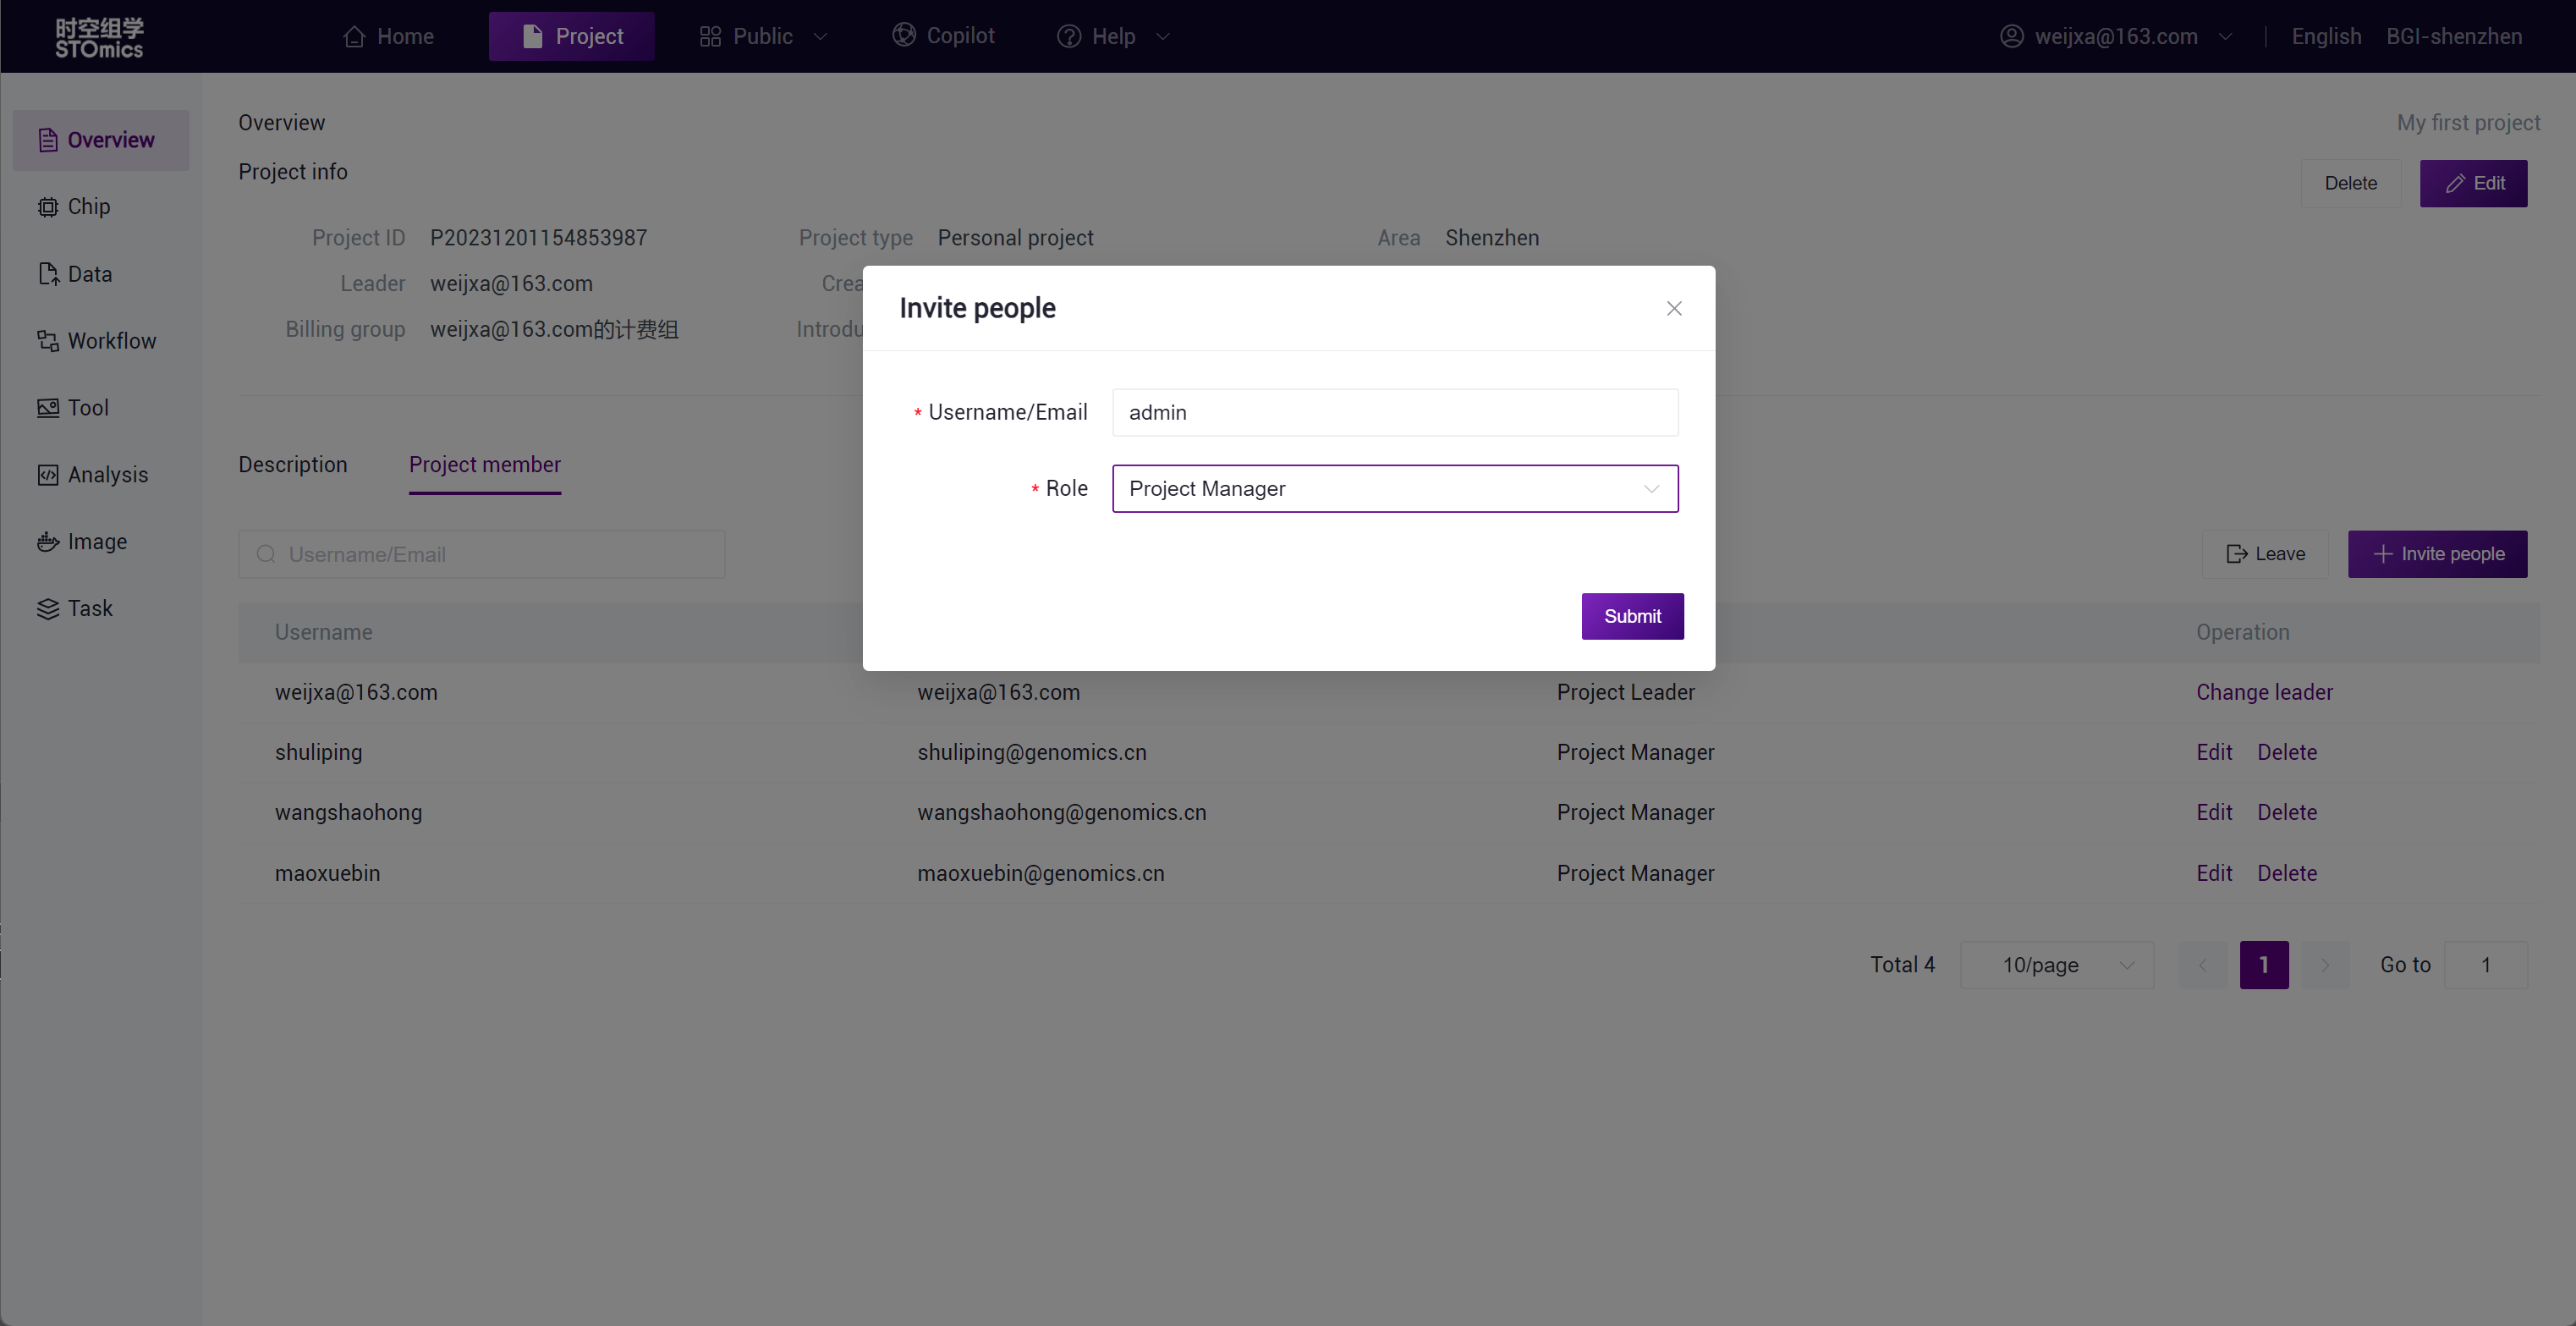
Click "Invite people," enter the username or email, and set the member role to add project members. Different roles will correspond to different operational permissions, see Project member management for details.
Once invited users join the project, they can access the project's resources, including tools and data, and participate in project collaboration.
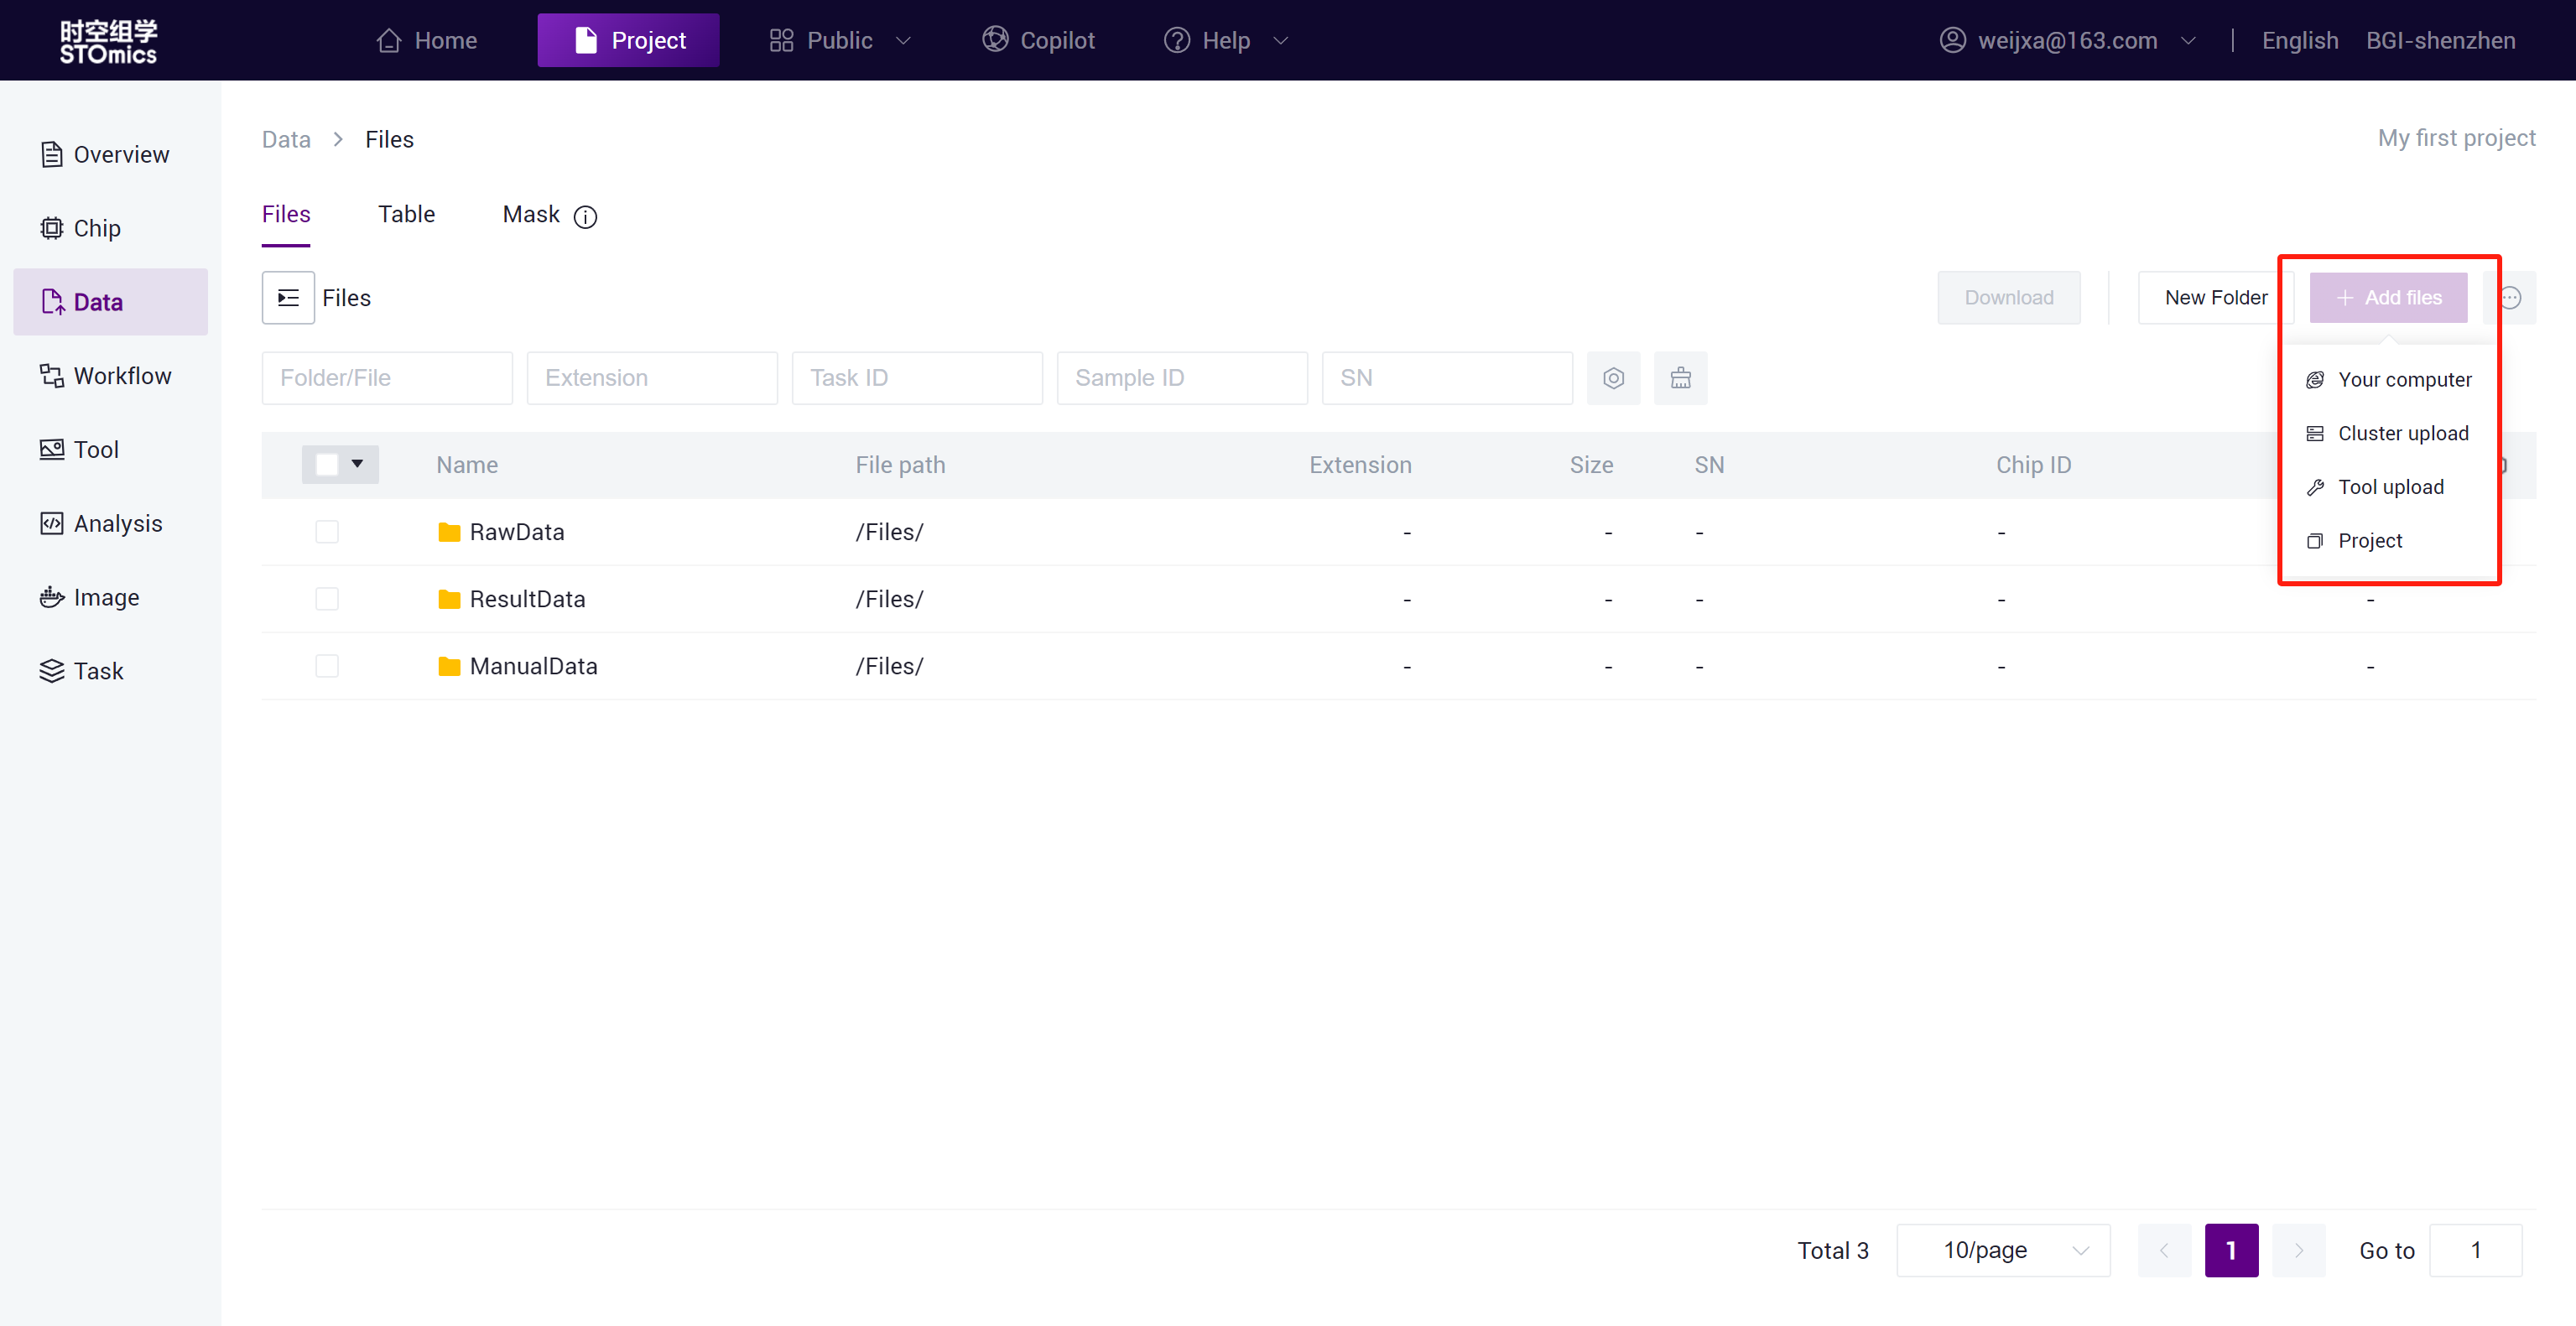
Upload Data
Upload the data required for analysis through Data, DCS Cloud provides four data upload solutions: Local upload, Cluster upload, Tool upload, and Copy from public project.
Data Analysis
Workflow Analysis
After preparing the analysis data, you can choose a workflow for data analysis. This tutorial's workflow analysis part will use the public workflow SAW‑ST‑V7 for analysis. The SAW software suite is a set of workflows that locate sequencing reads to spatial positions on tissue sections, quantify spatial gene expression, overlay spatial gene expression information on tissue images to obtain morphological information, and visually present the spatial expression distribution. SAW processes Stereo‑seq sequencing data to generate spatial gene expression matrices, which users can then use as a starting point for downstream analysis.
Add a Public Workflow
Copy a workflow from the public app:
In the project Workflow module, click "Add Workflow - Copy from Public Library";
Search for "SAW‑ST‑V7";
Click the "Copy" button on the workflow card, copying the workflow in the project as Copy‑SAW‑ST‑V7.
You can also create a new workflow in the project, see Create workflow for details.
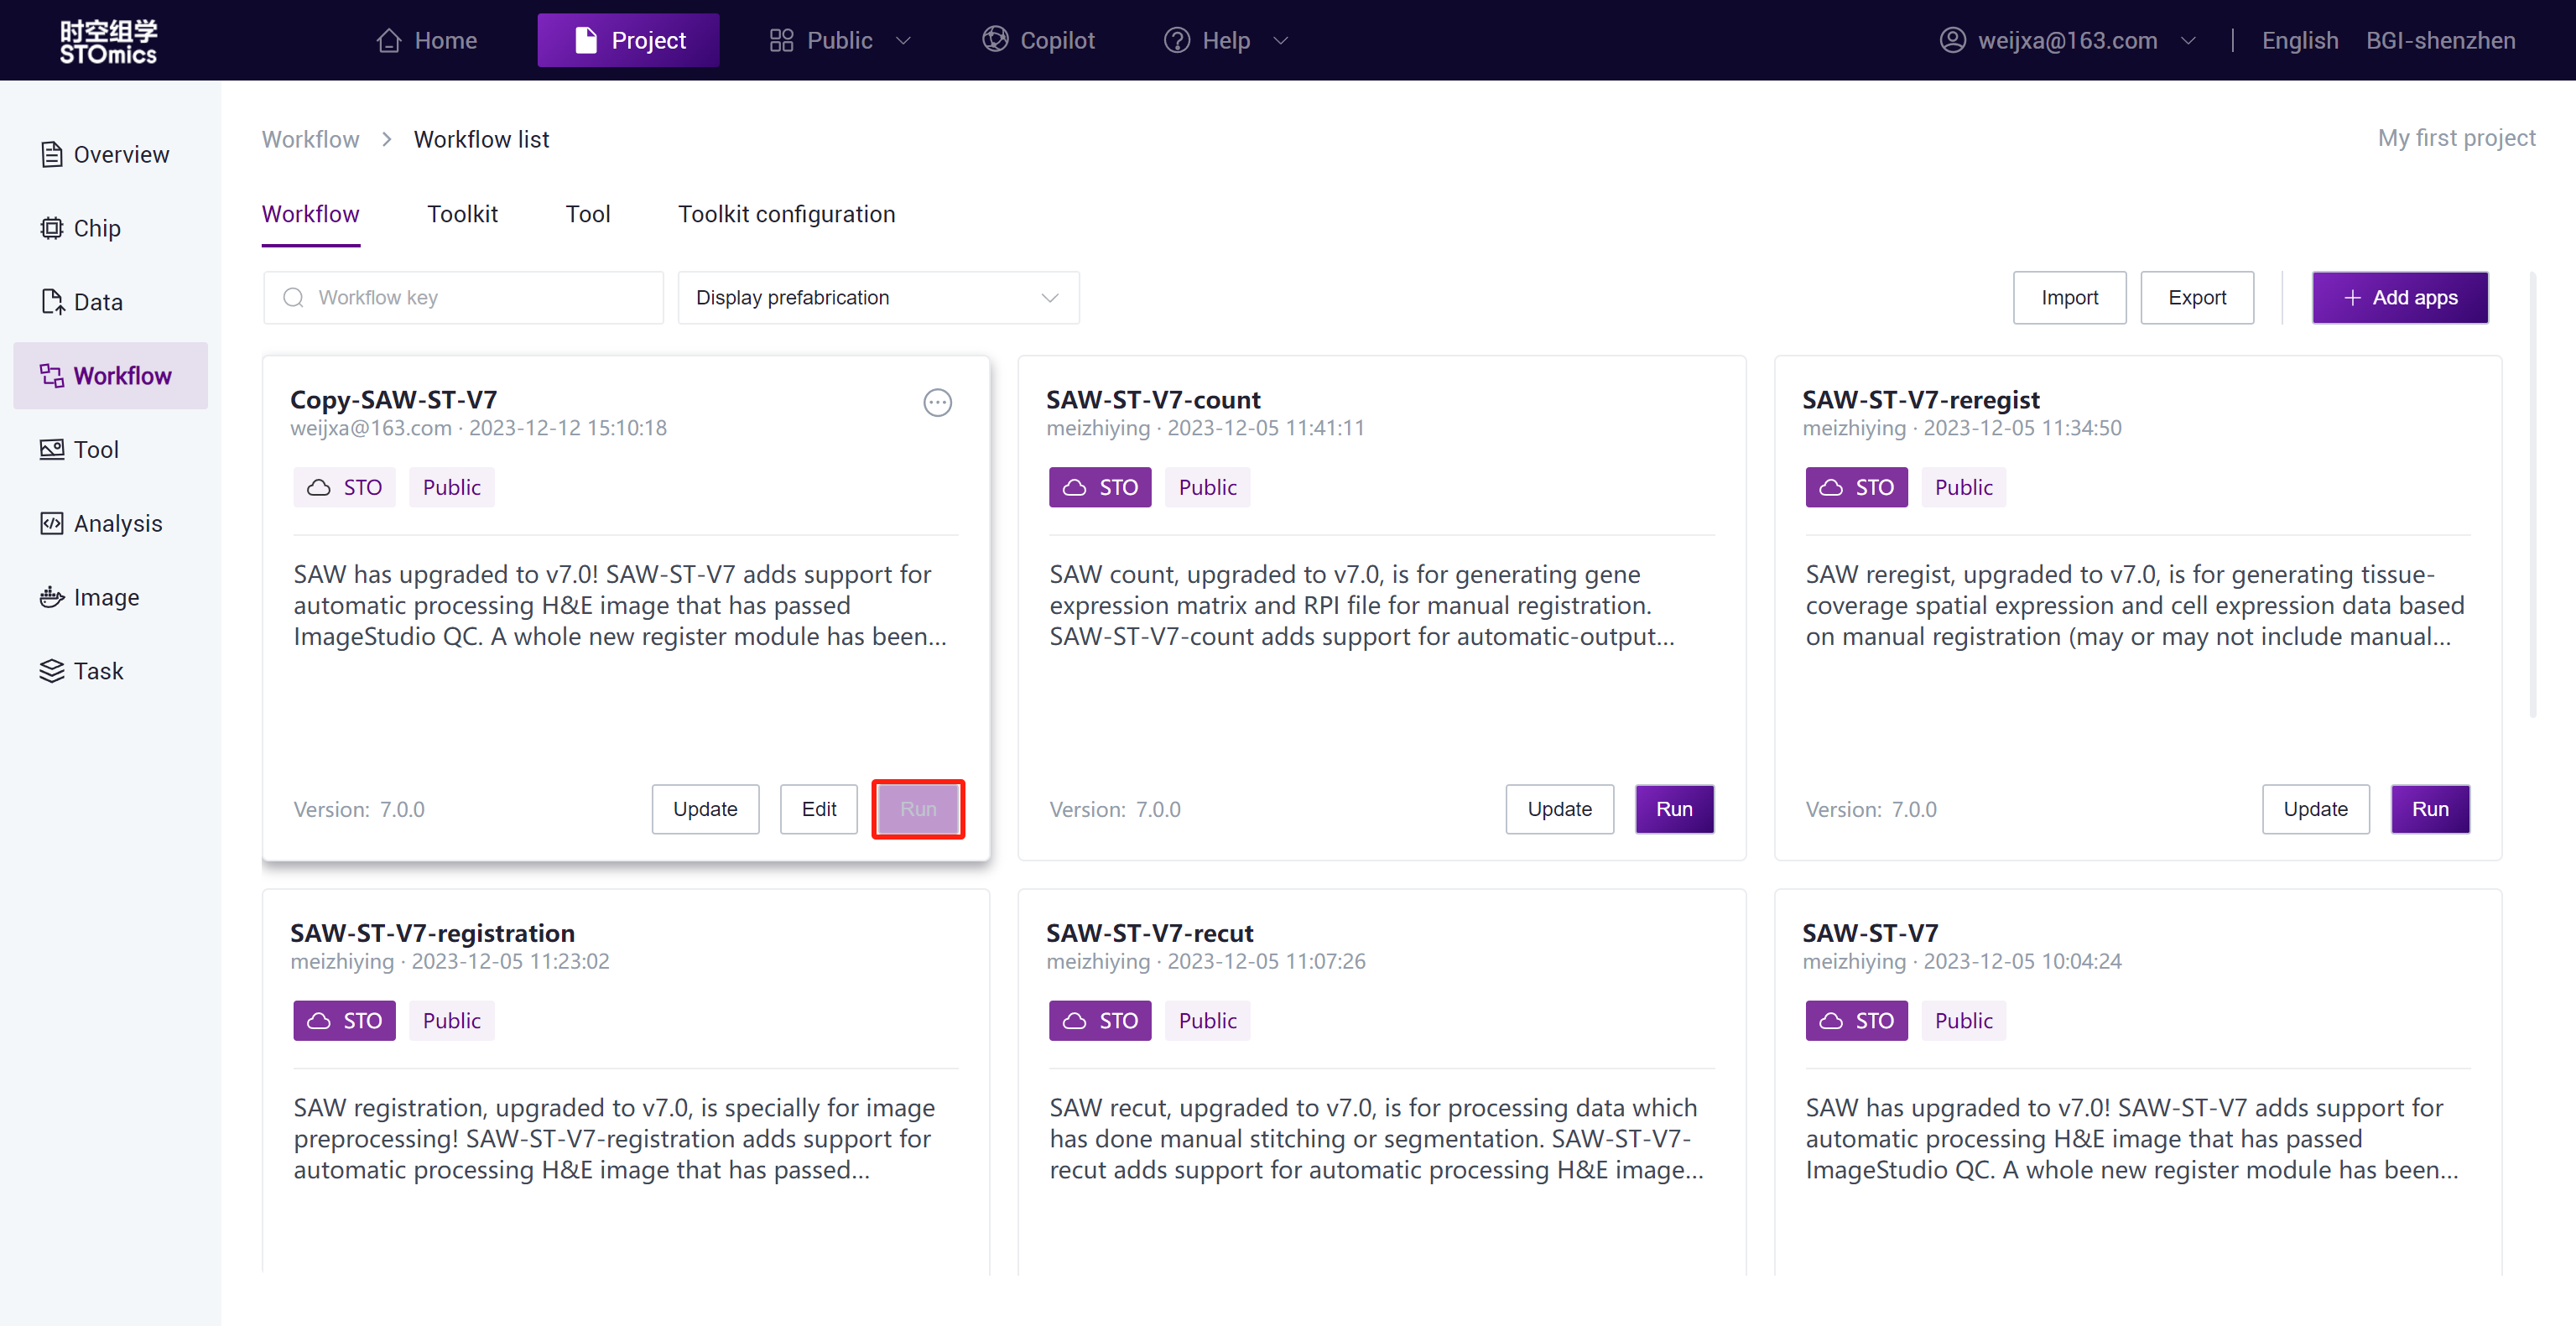
Run Analysis
After data and workflow preparation, you can run the analysis.
Step1: Run the copied Copy-SAW-ST-V7 workflow from the public library.
Step2: Select the run interface input, fill in the workflow parameters, and run.
For large batch analysis needs, the platform also provides batch analysis. You can select table data input, see Running Workflows-Table Delivery for details.
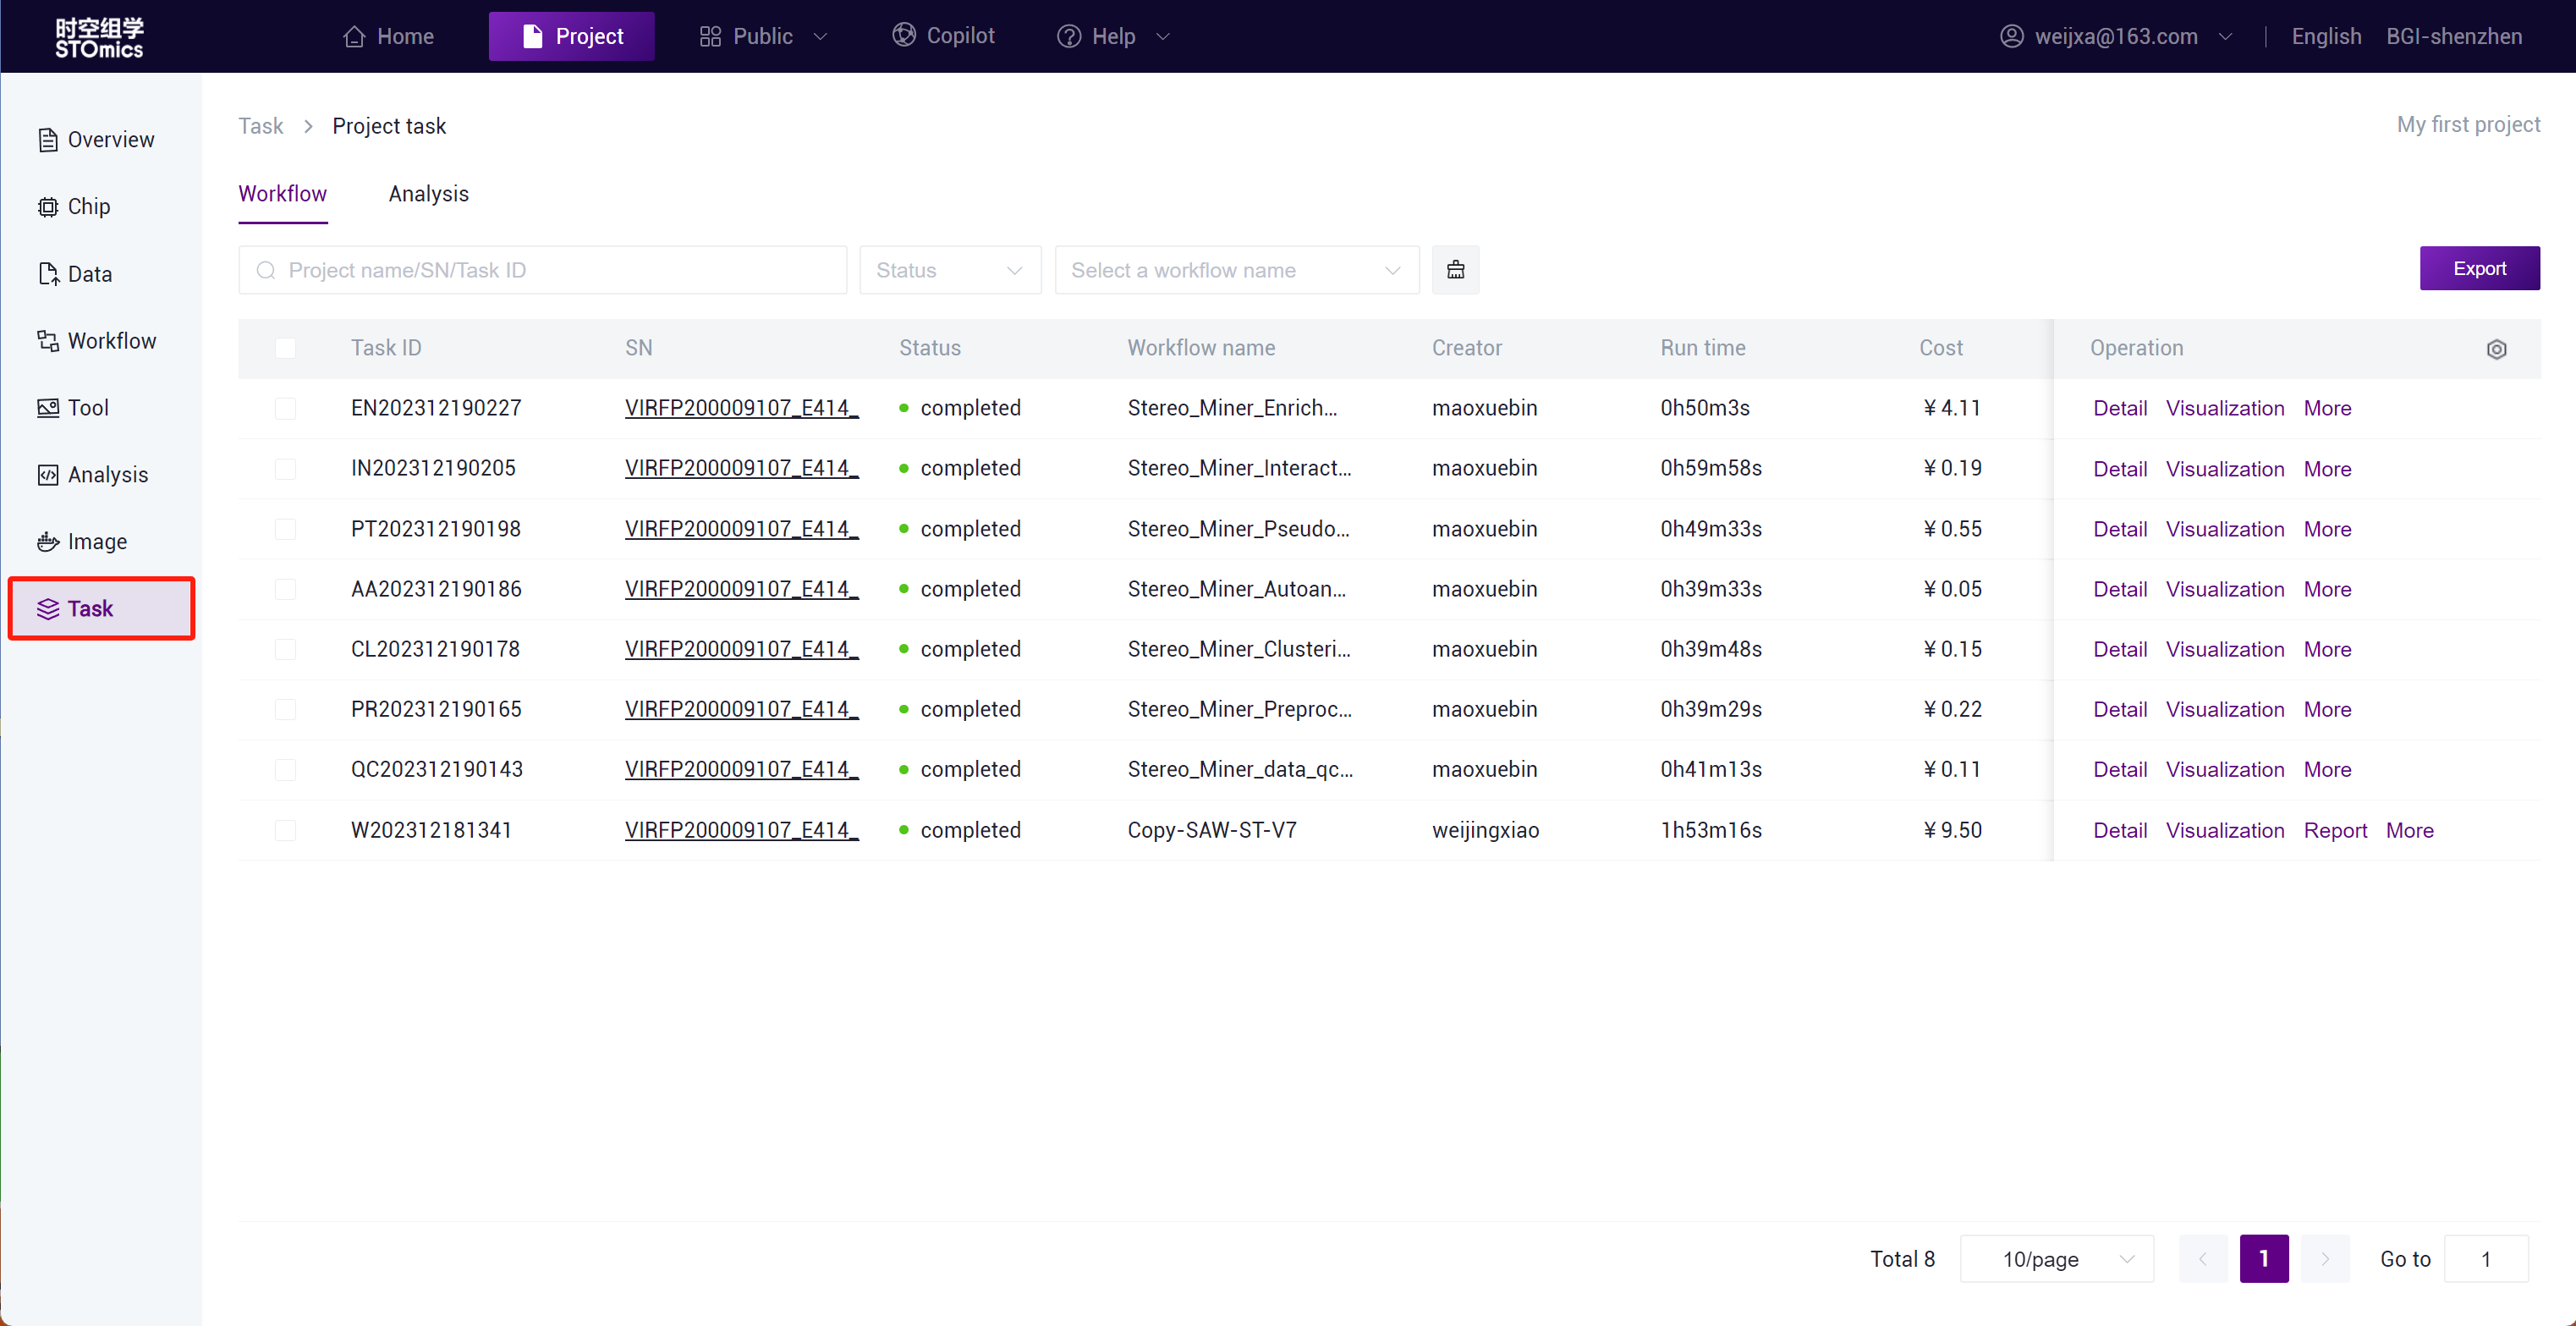
Step3: After the task delivery is completed, you can view the task running status in the Task- Workflow module.
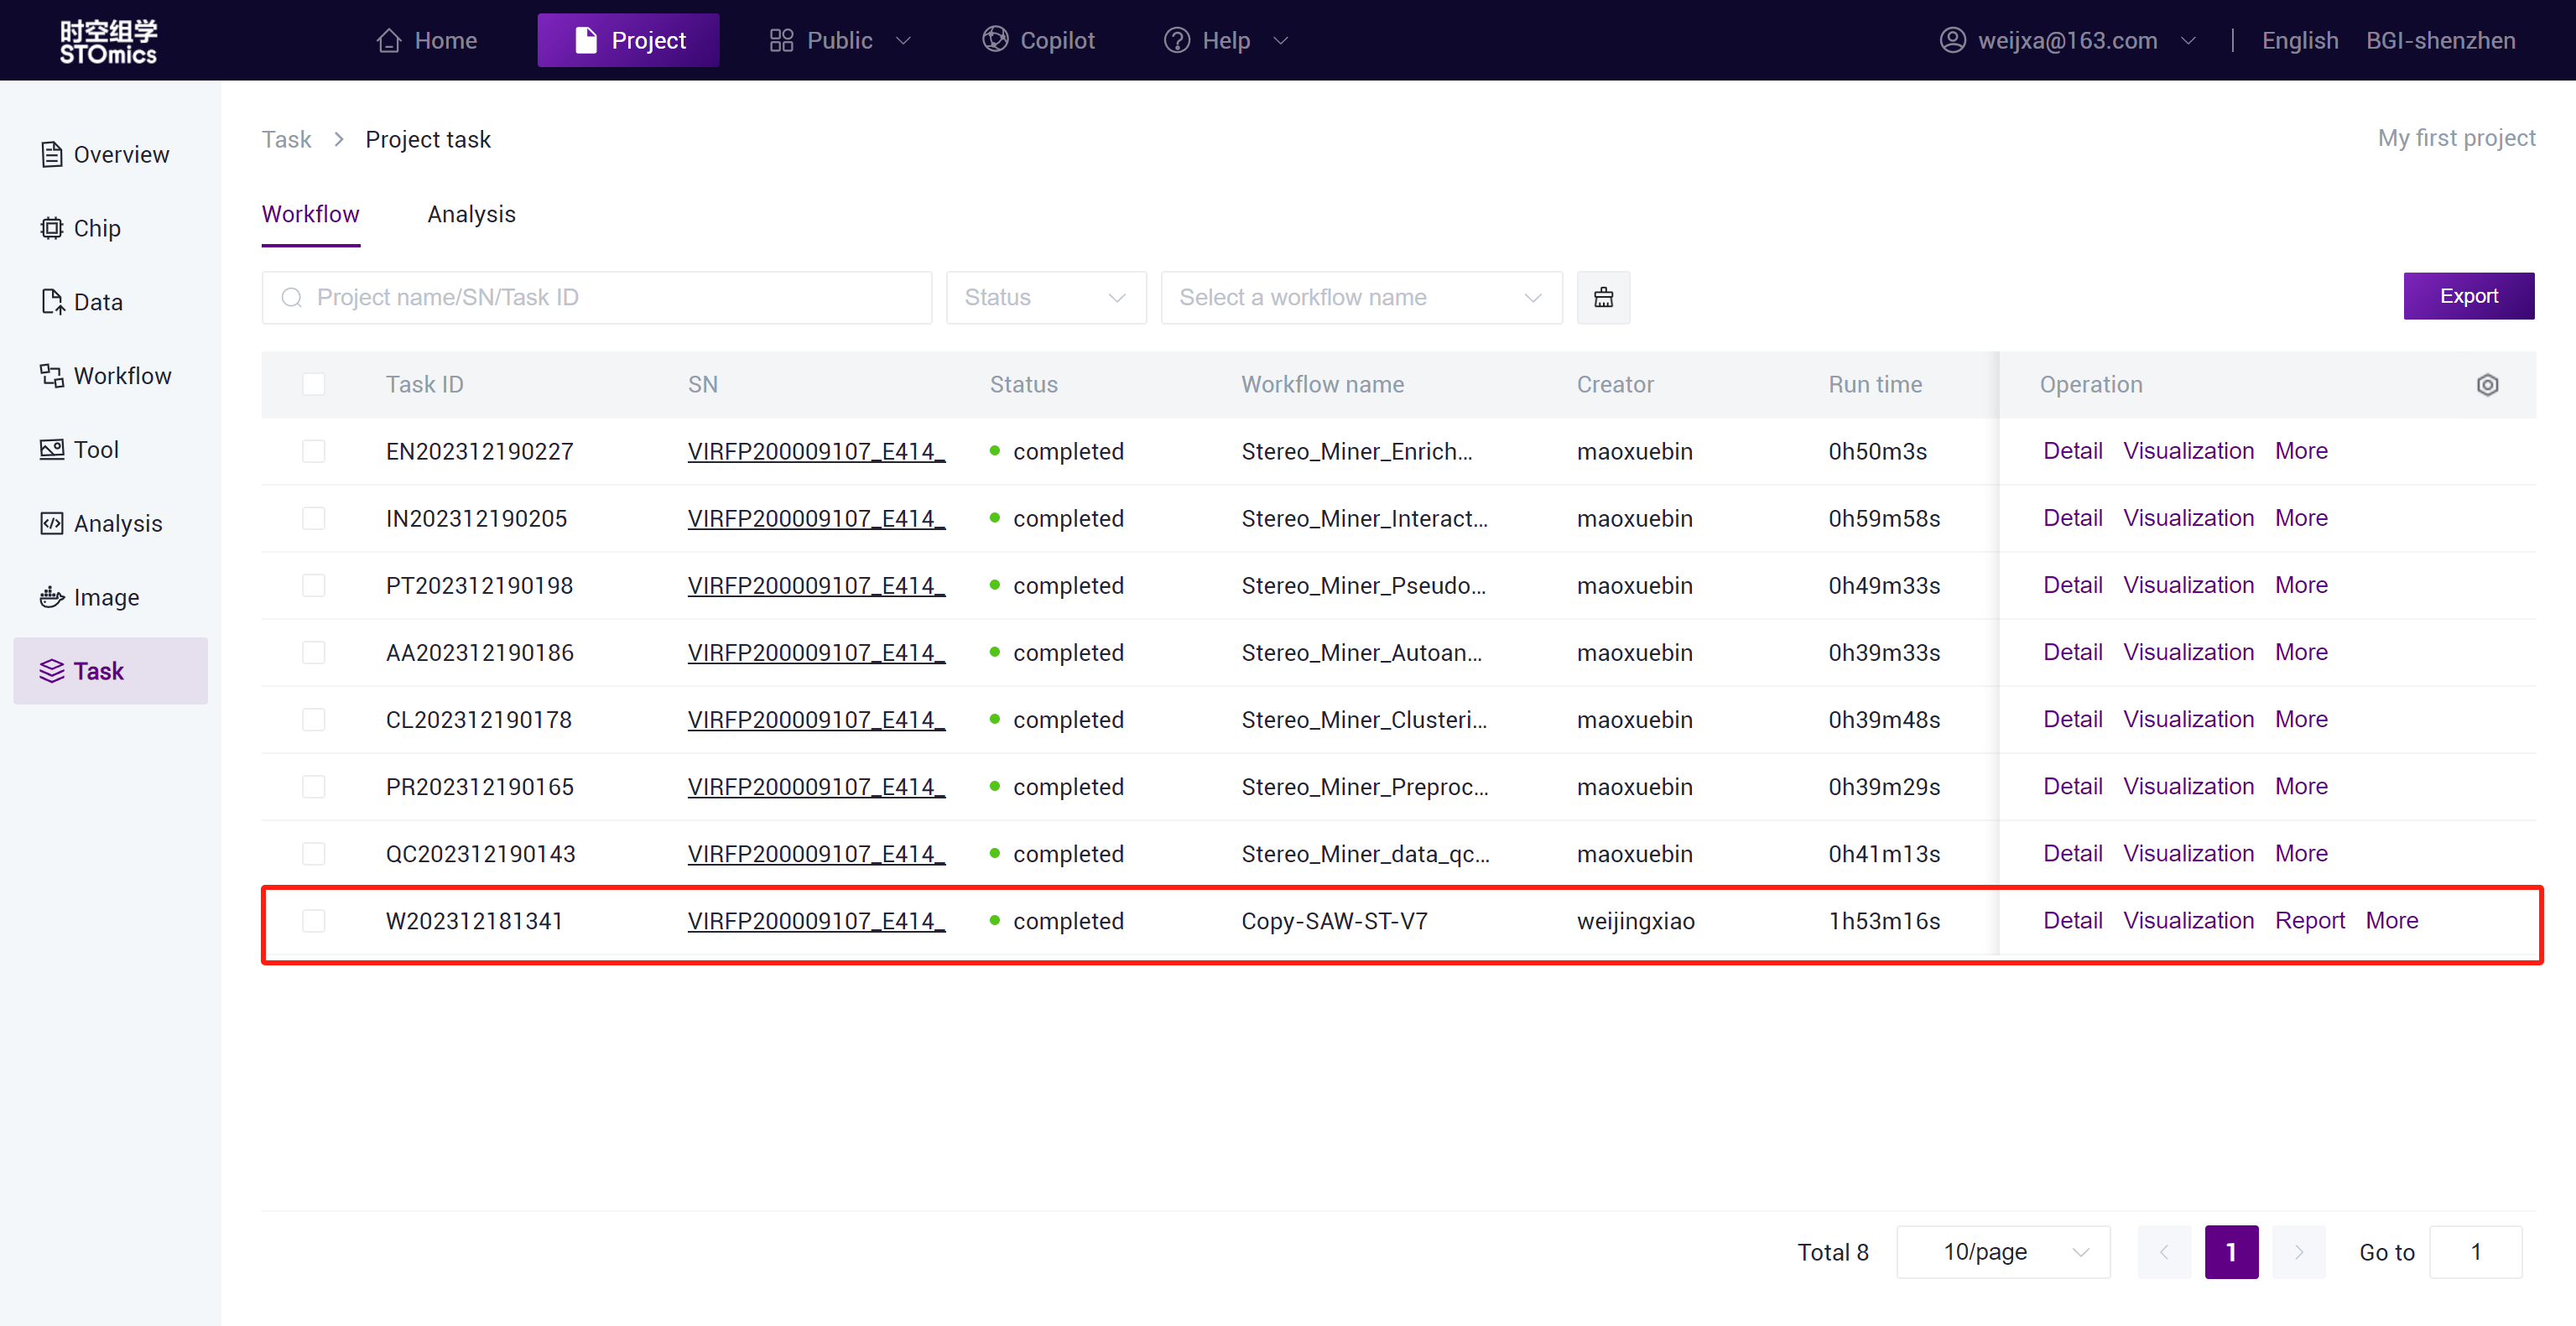
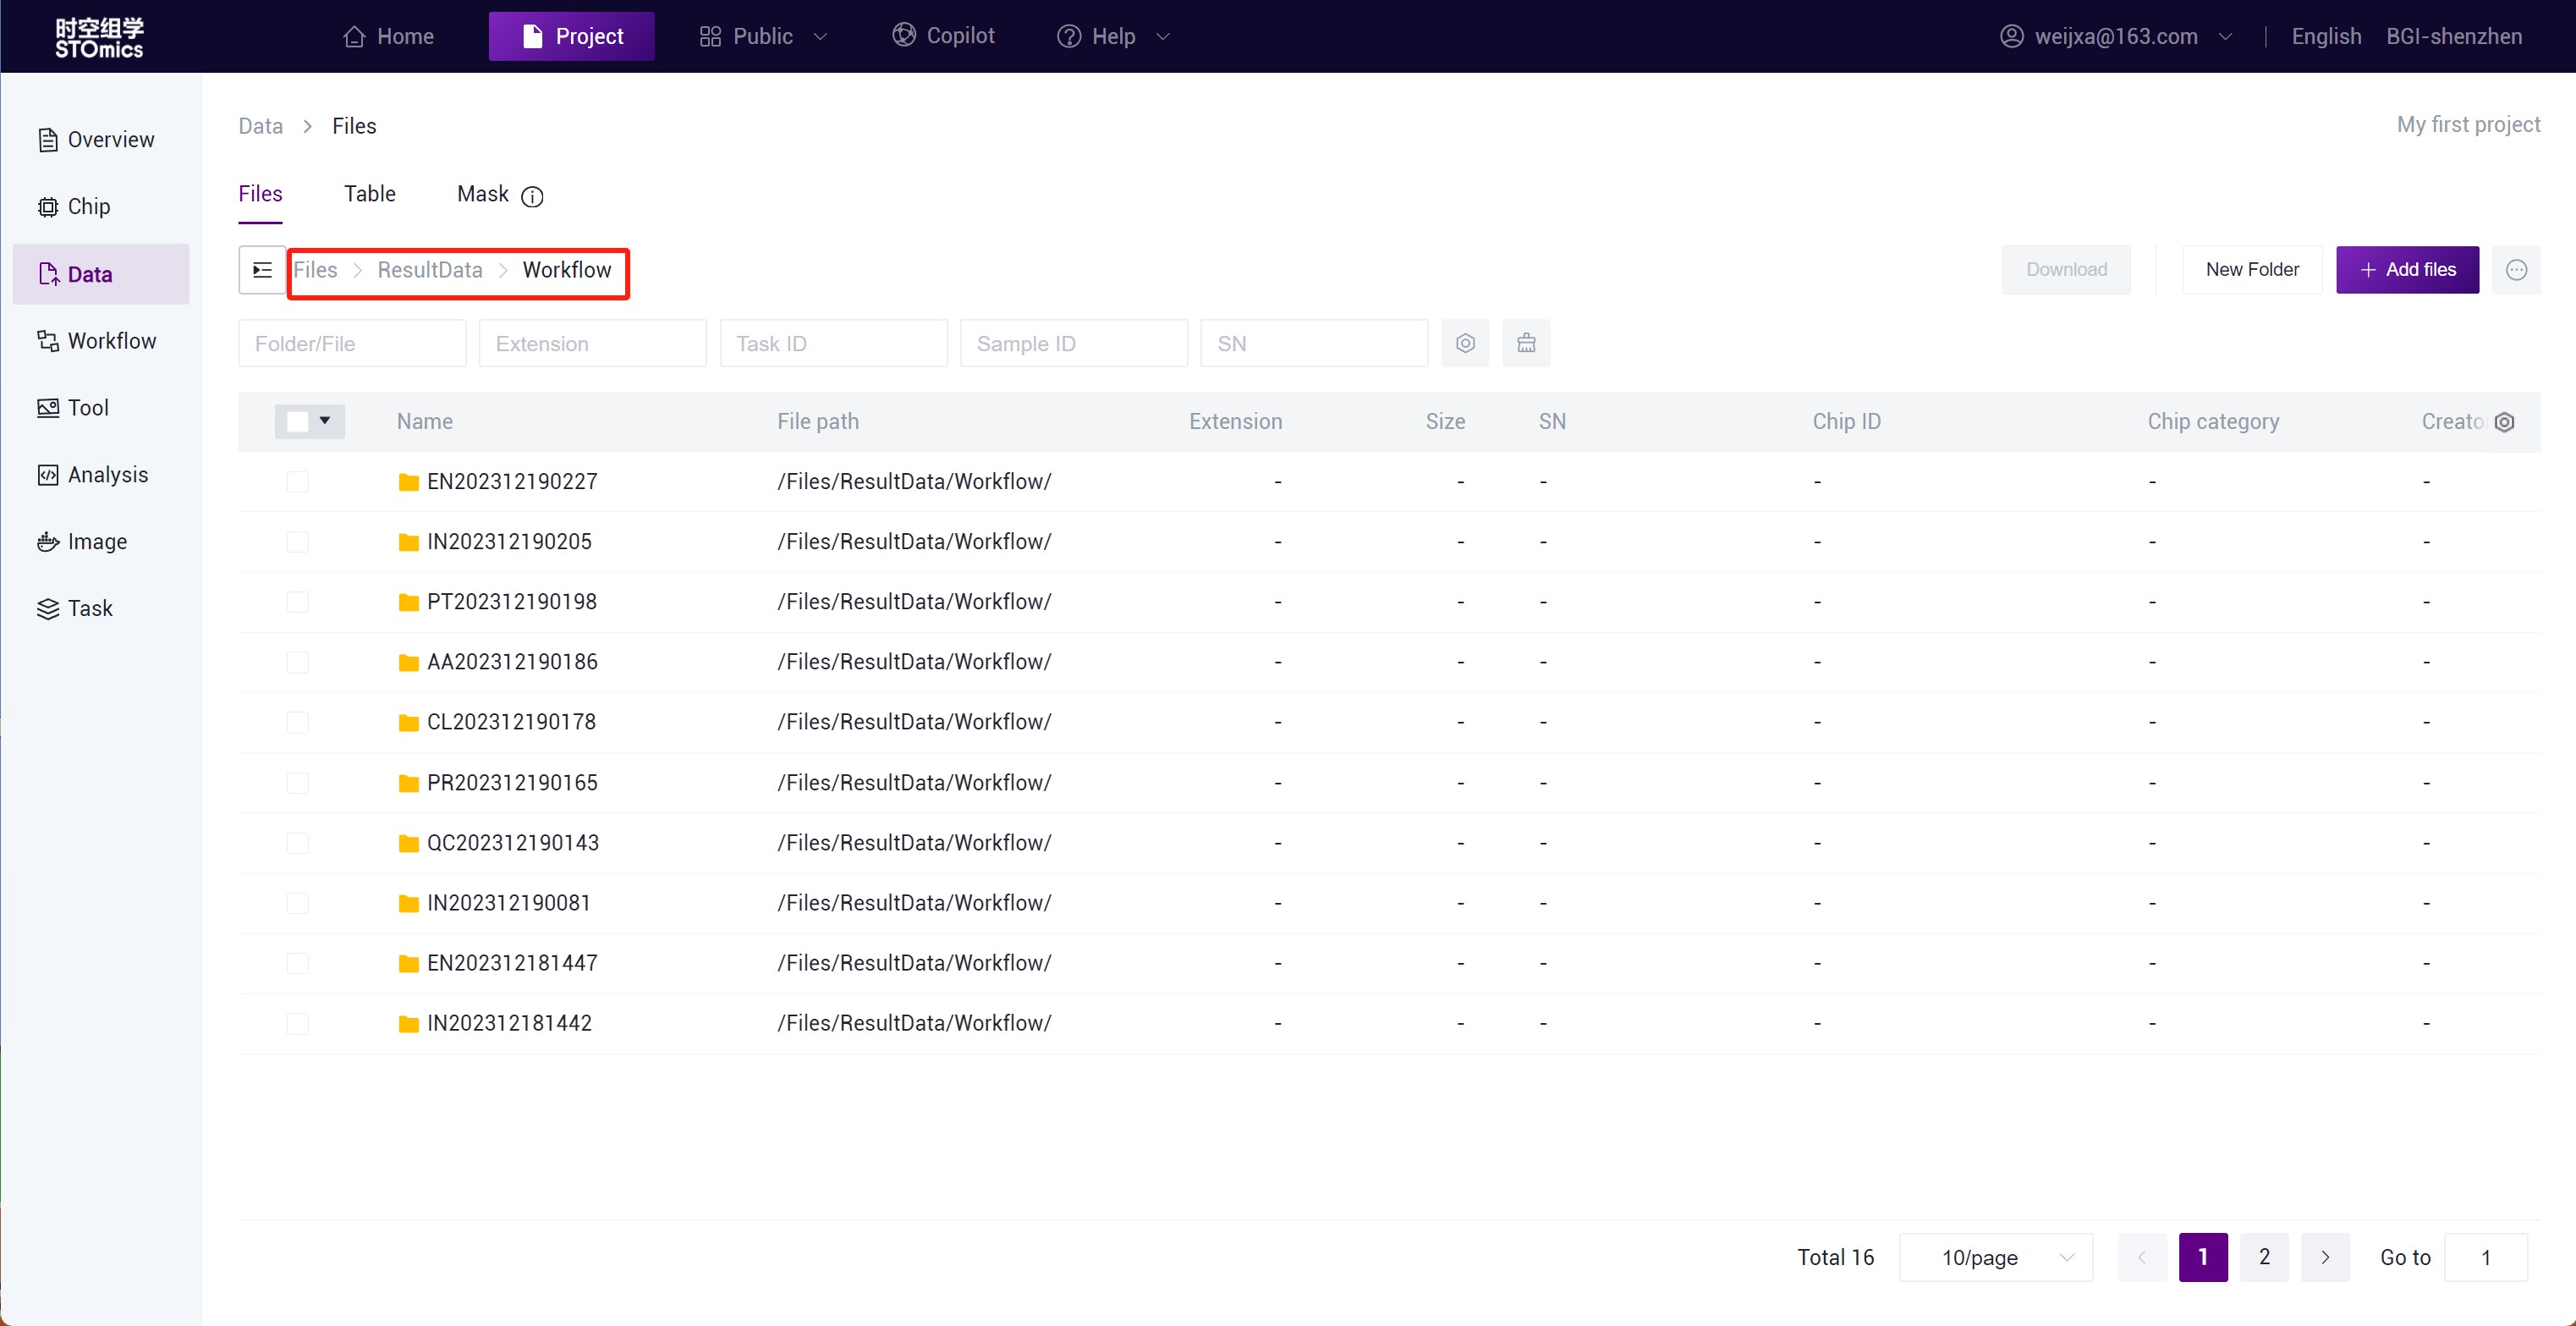
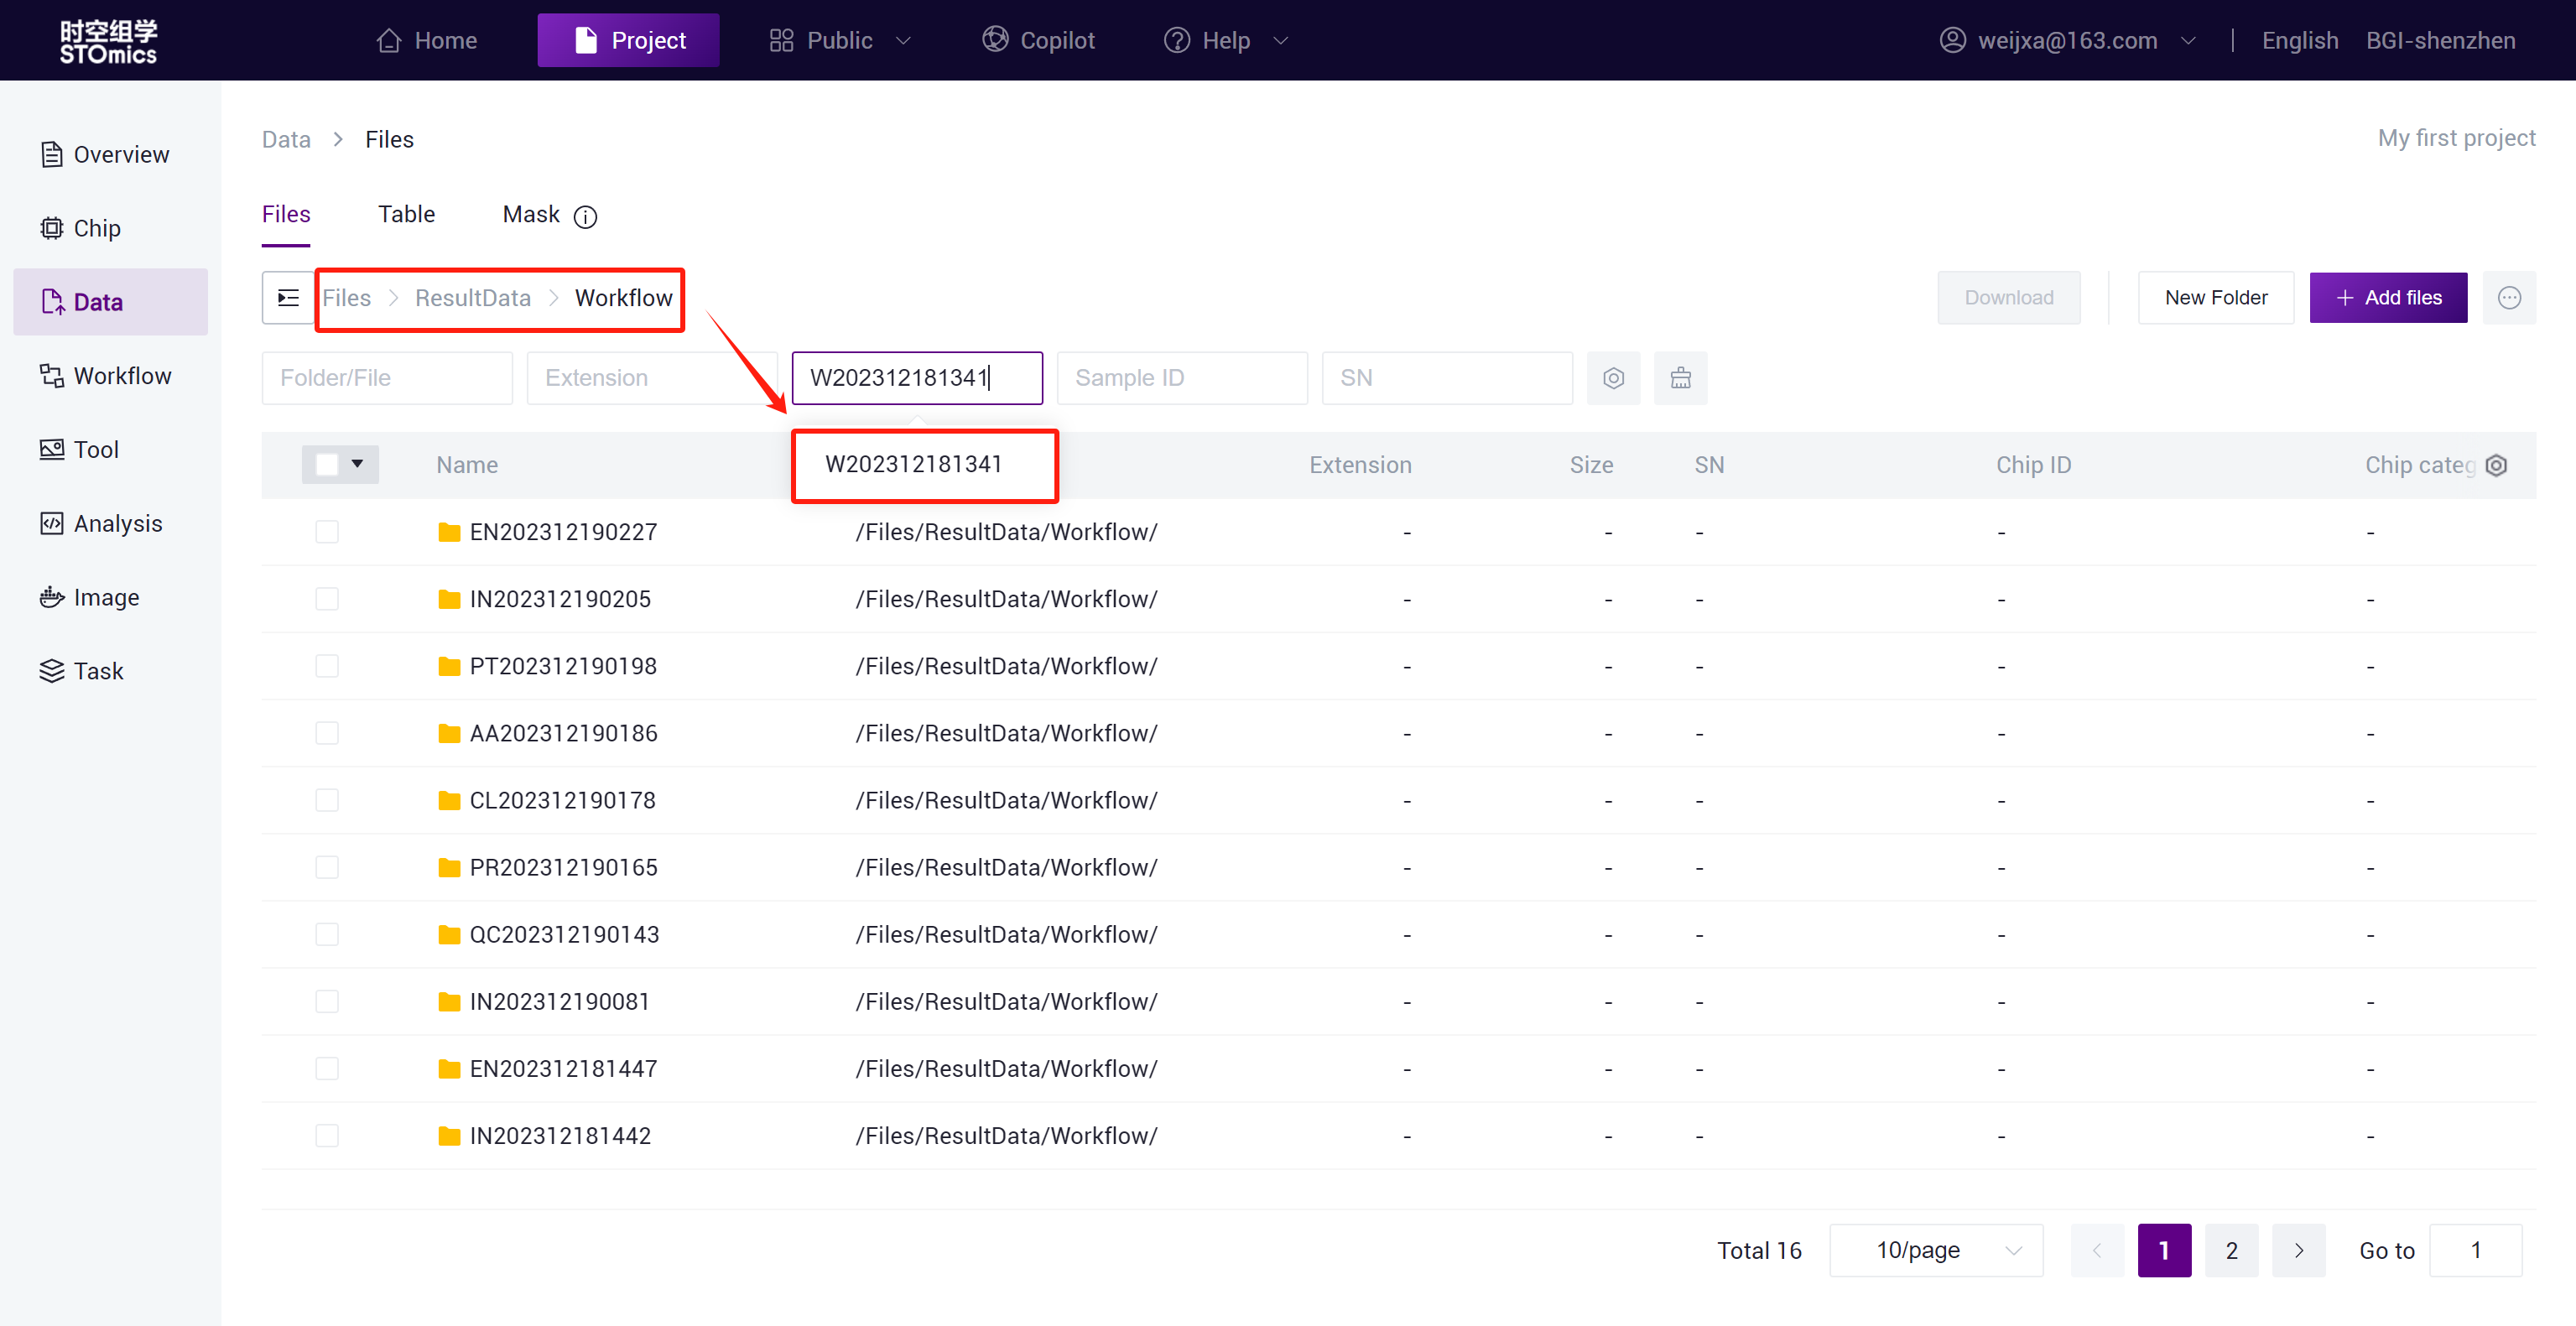
The task result data will be automatically synchronized to the project Data ,and you can search for the task result files in the /Files/ResultData/Workflow/ directory by task number.
Interactive Analysis - StereoMiner(Advanced Analysis)
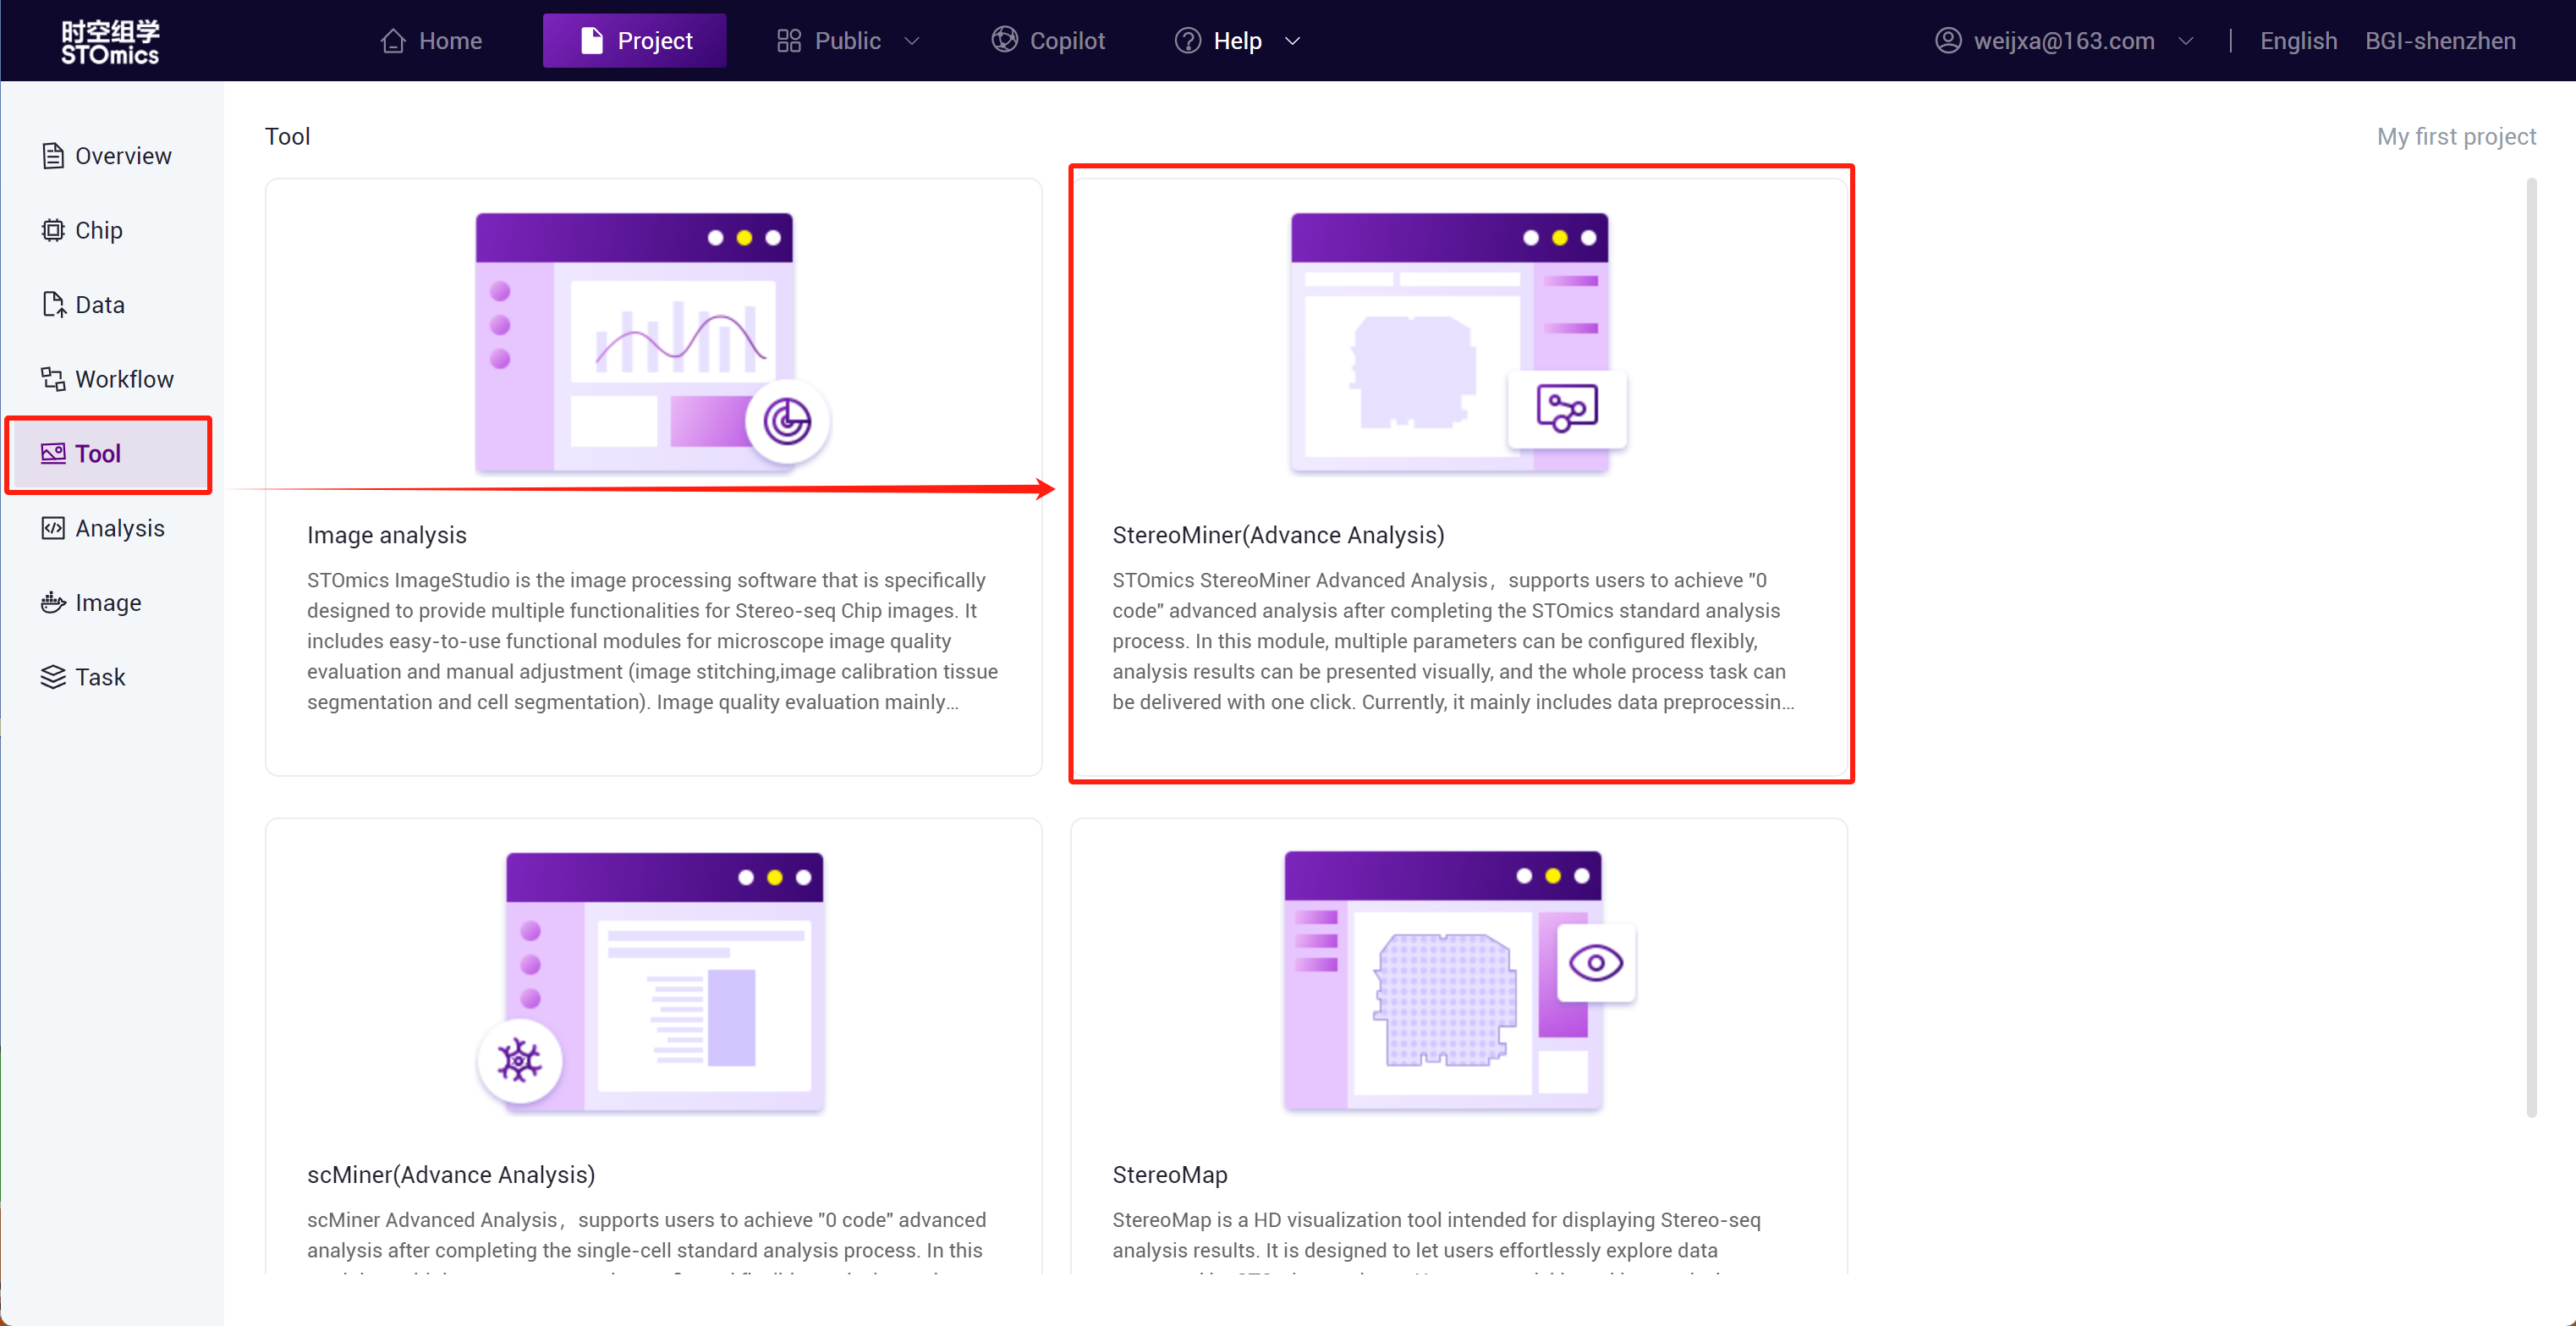
Advanced STOmics Analysis After completing the SAW workflow analysis on DCS Cloud, you can perform zero‑code advanced analysis with flexible configuration of various parameters, intuitive presentation of analysis results, and one‑click delivery of the entire process task. The main processes include data preprocessing, clustering/annotation, pseudotime analysis, cell interaction analysis, functional enrichment analysis, and ultimately forming an advanced analysis report, completing the delivery of temporal and spatial analysis.
Enter Analysis Interface
Click the advanced STOmics analysis in the Tool module to enter the analysis interface.
Run Analysis
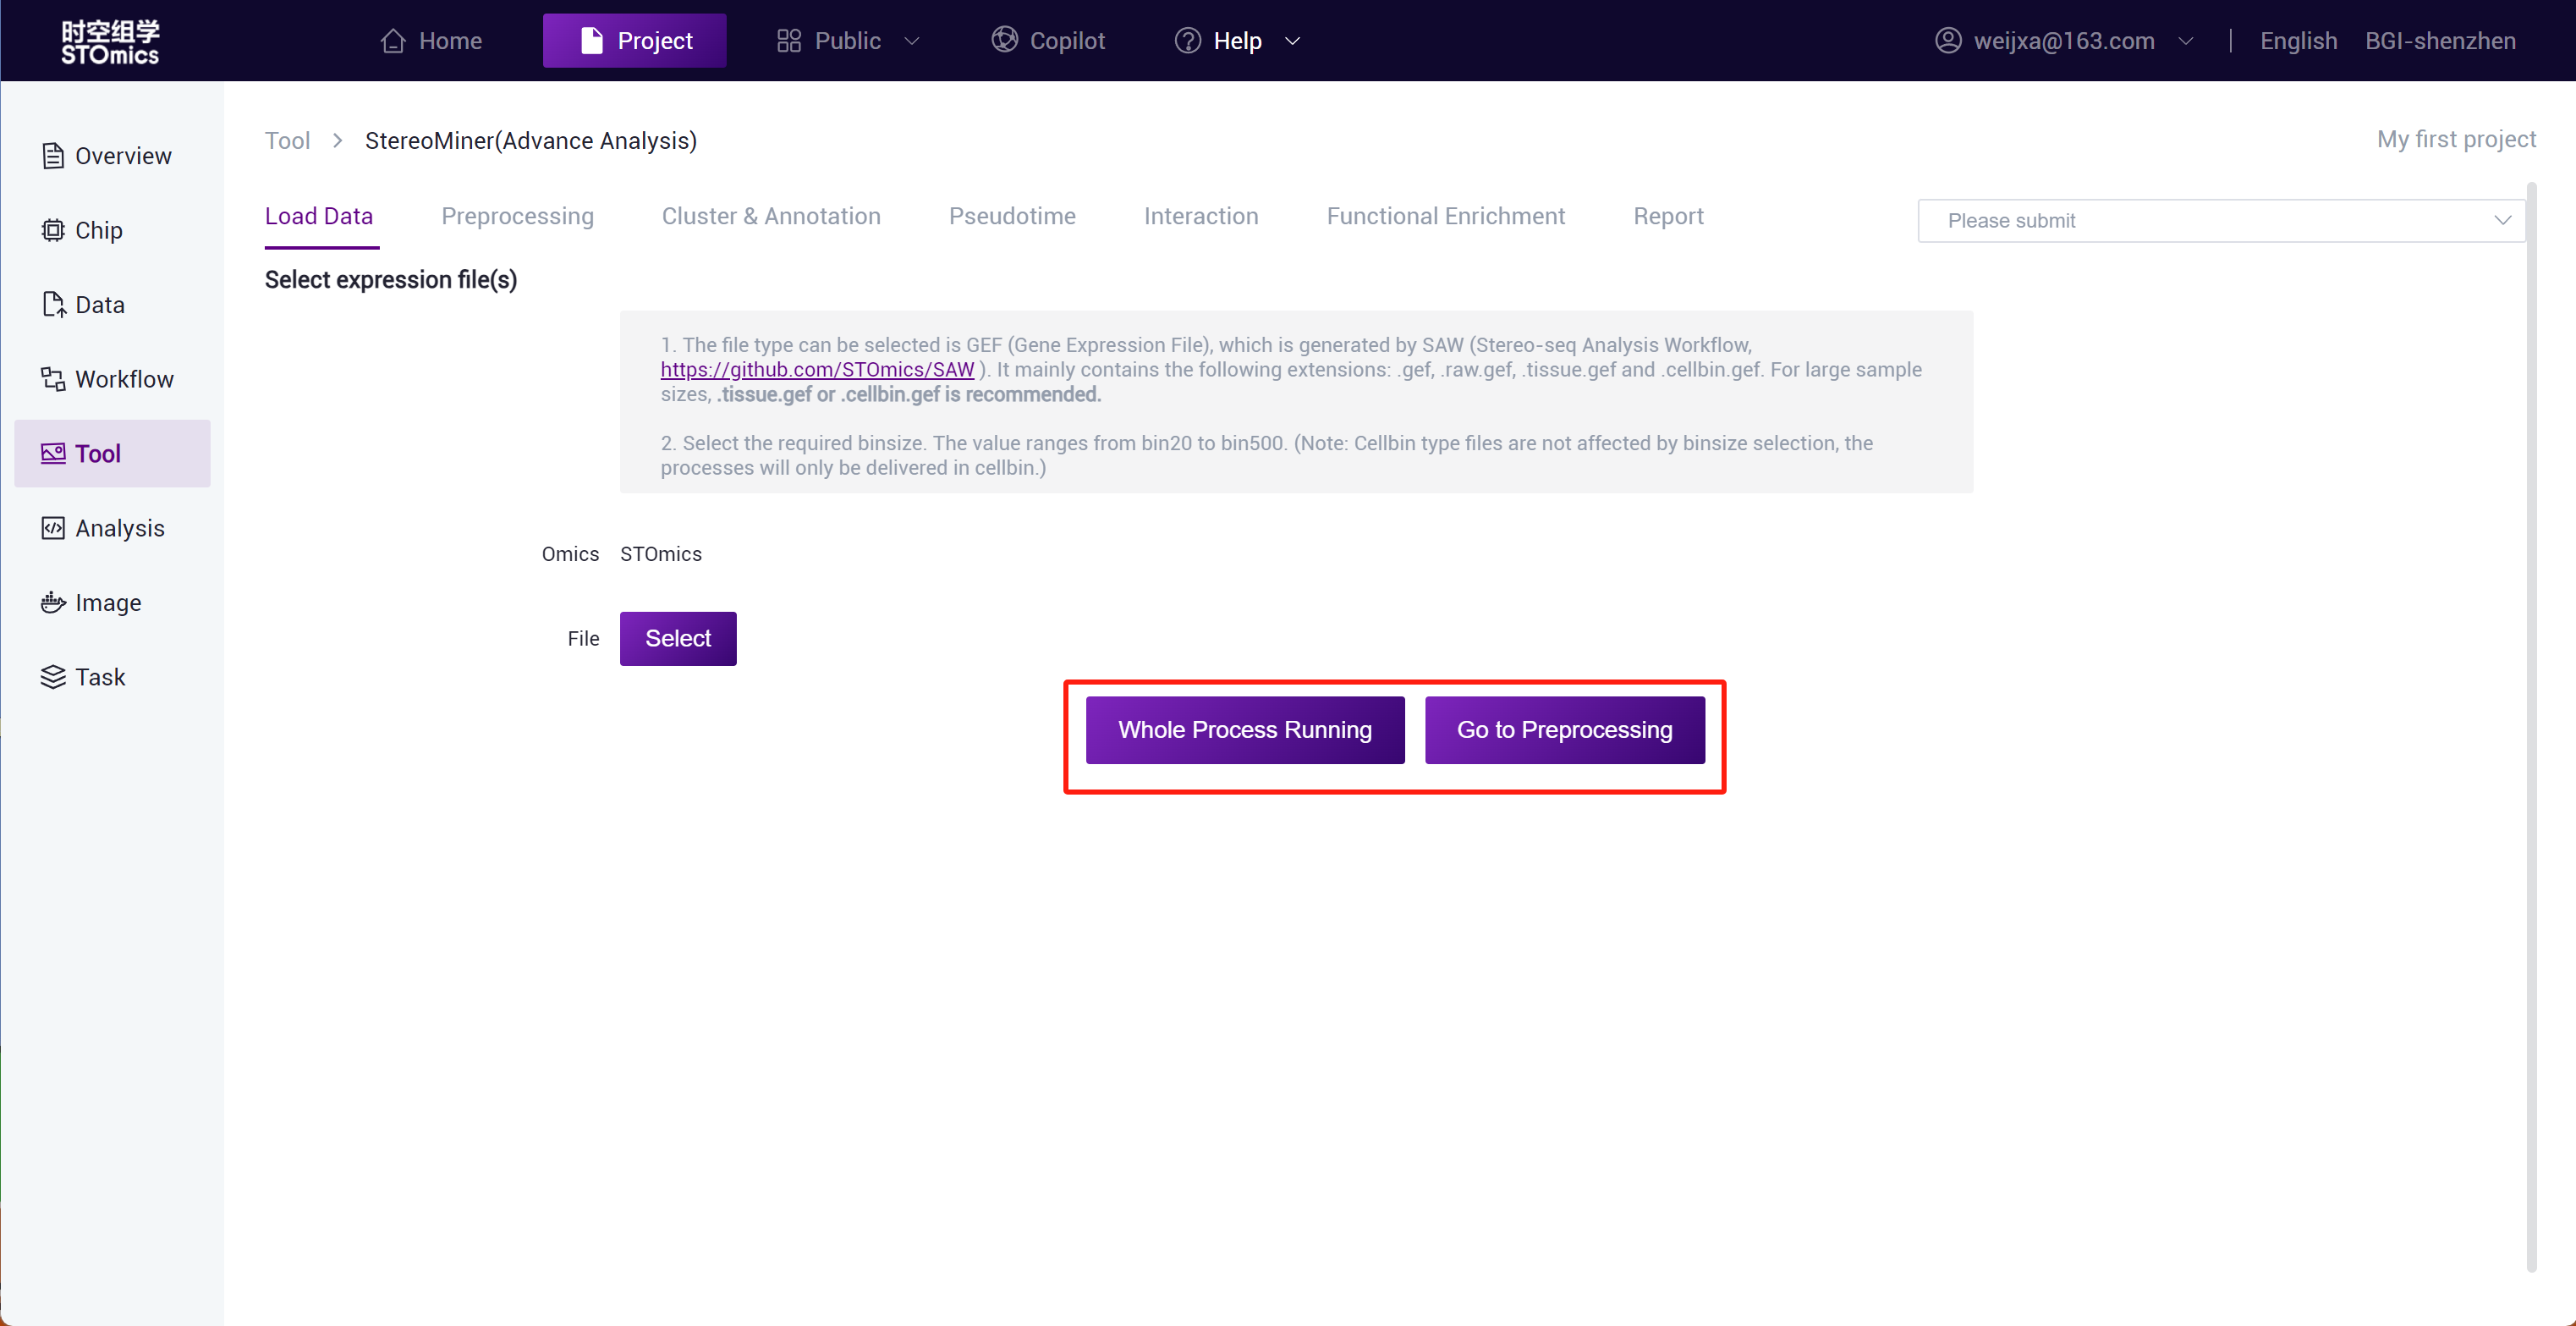
Step1: Select the gef‑related file from the result files of the SAW workflow analysis.
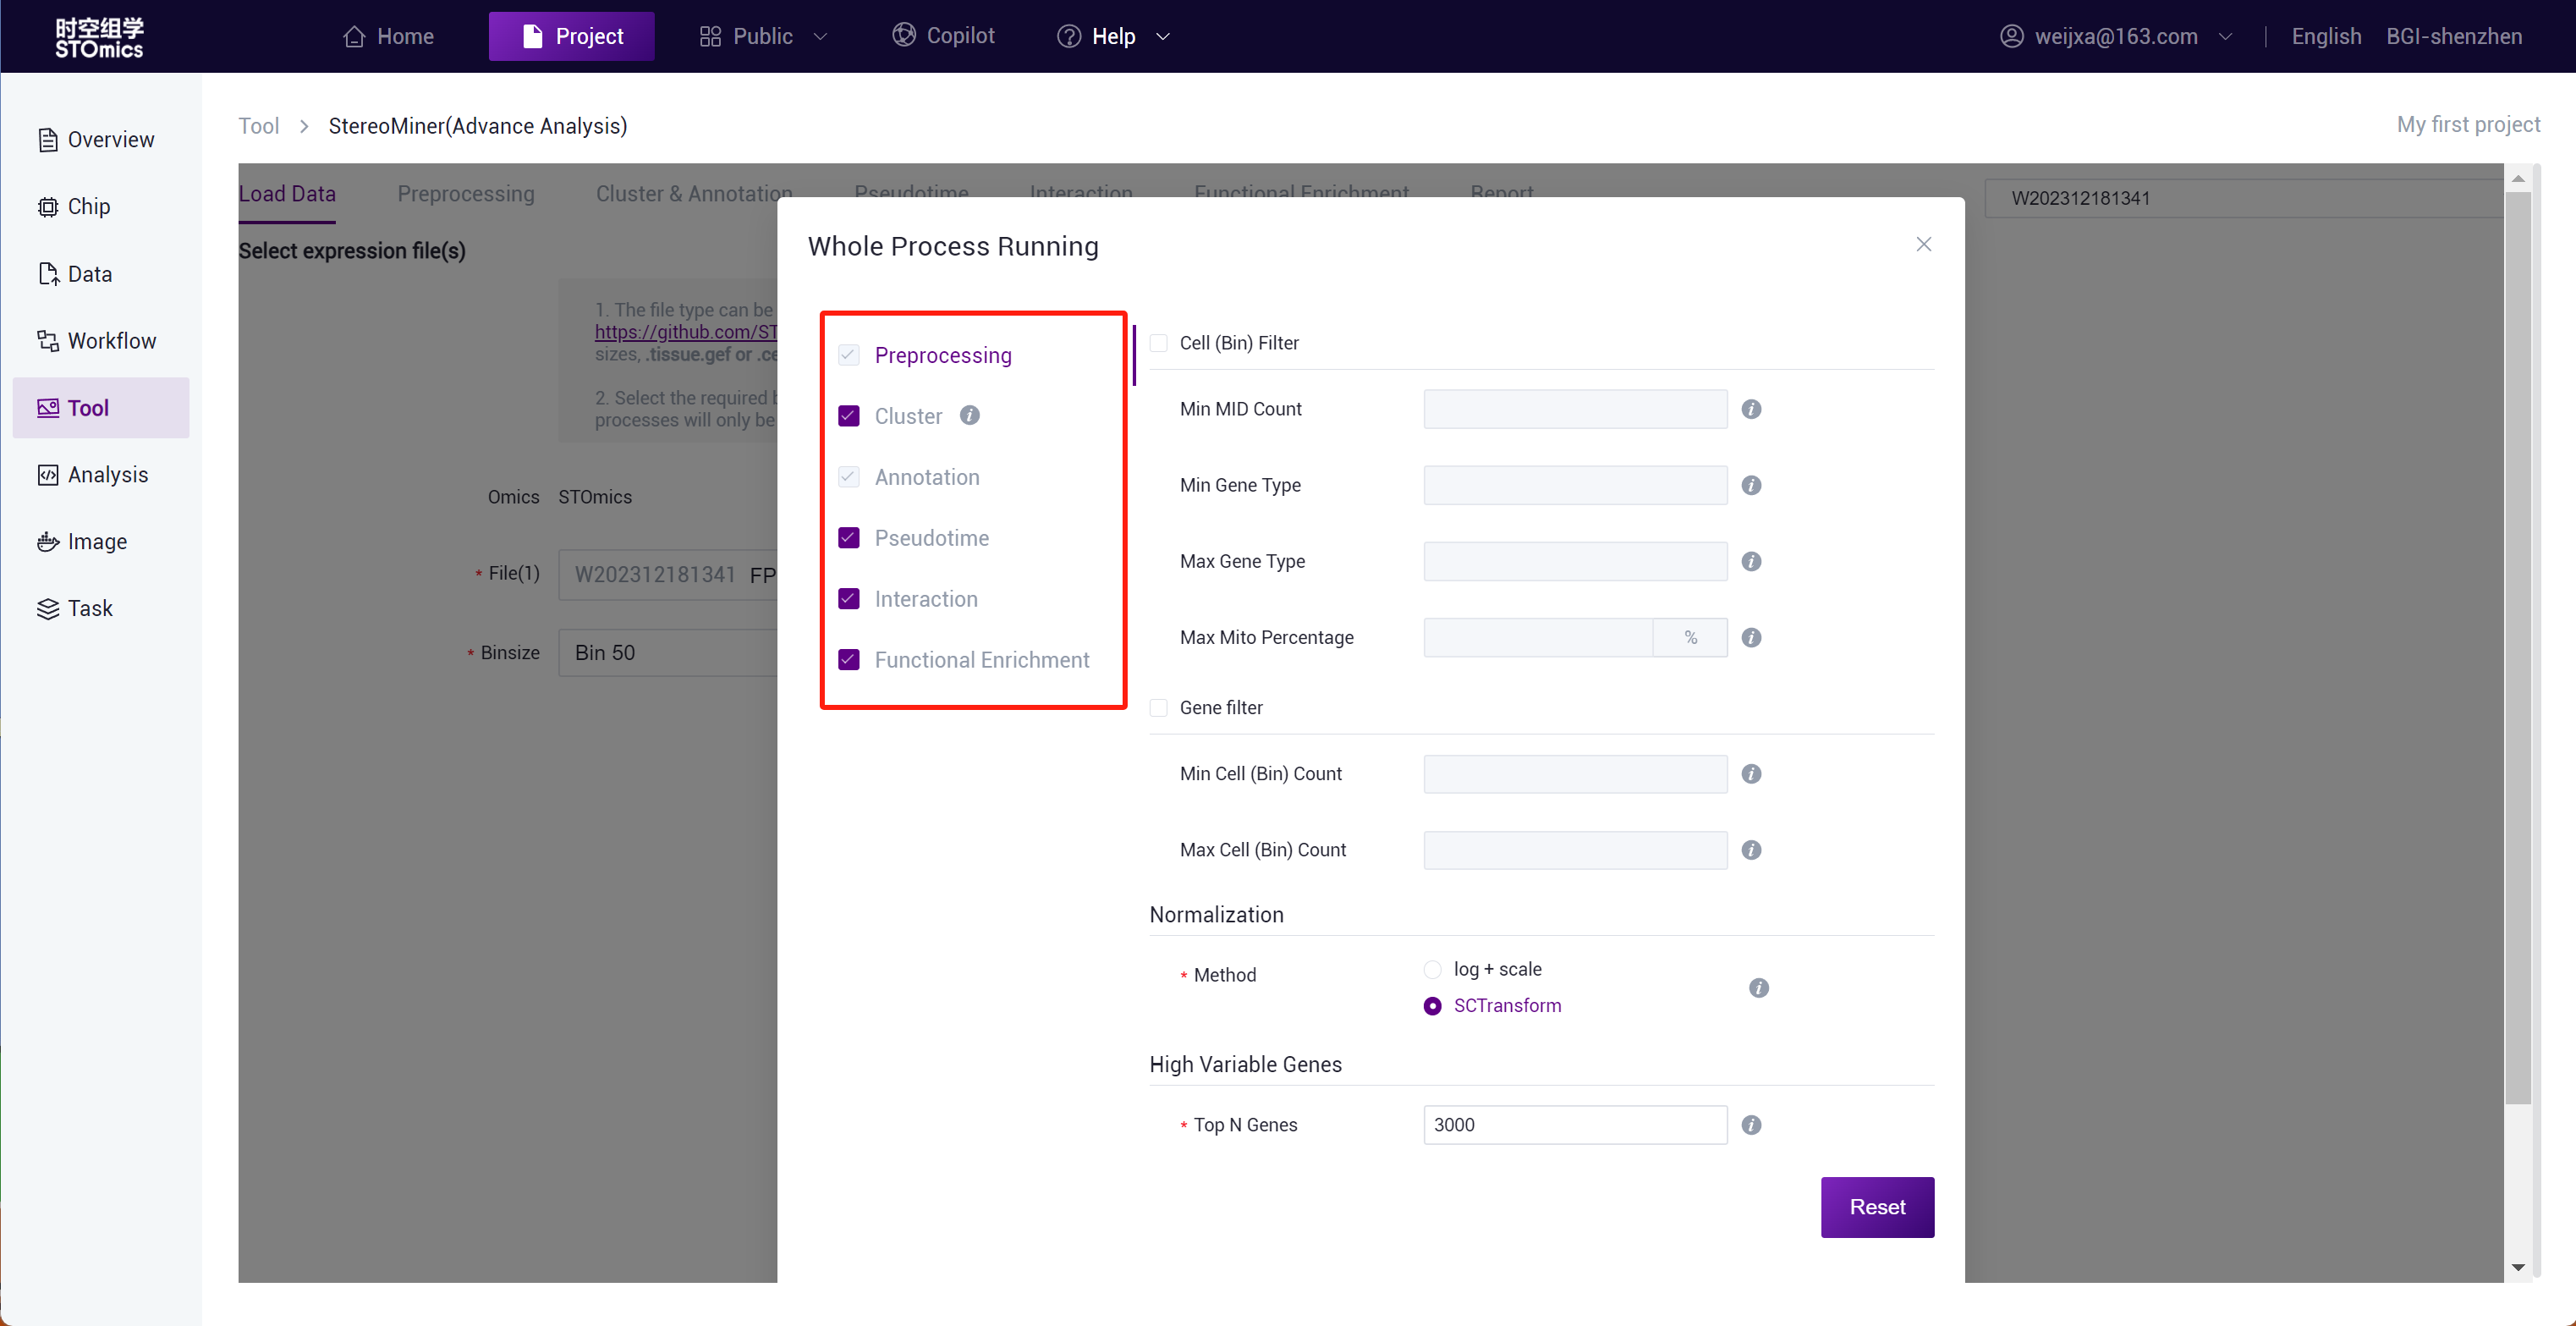
Step2: You can click "Full Process Delivery" or submit preprocessing to achieve automatic delivery or manual step‑by‑step delivery of the process.
Step3: Full process delivery and manual step‑by‑step submission of preprocessing can both adjust analysis parameters through the adjustment panel.
Step4: After submitting, you can view the task running status in the Task- Workflow module.

Interactive Analysis - StereoMap
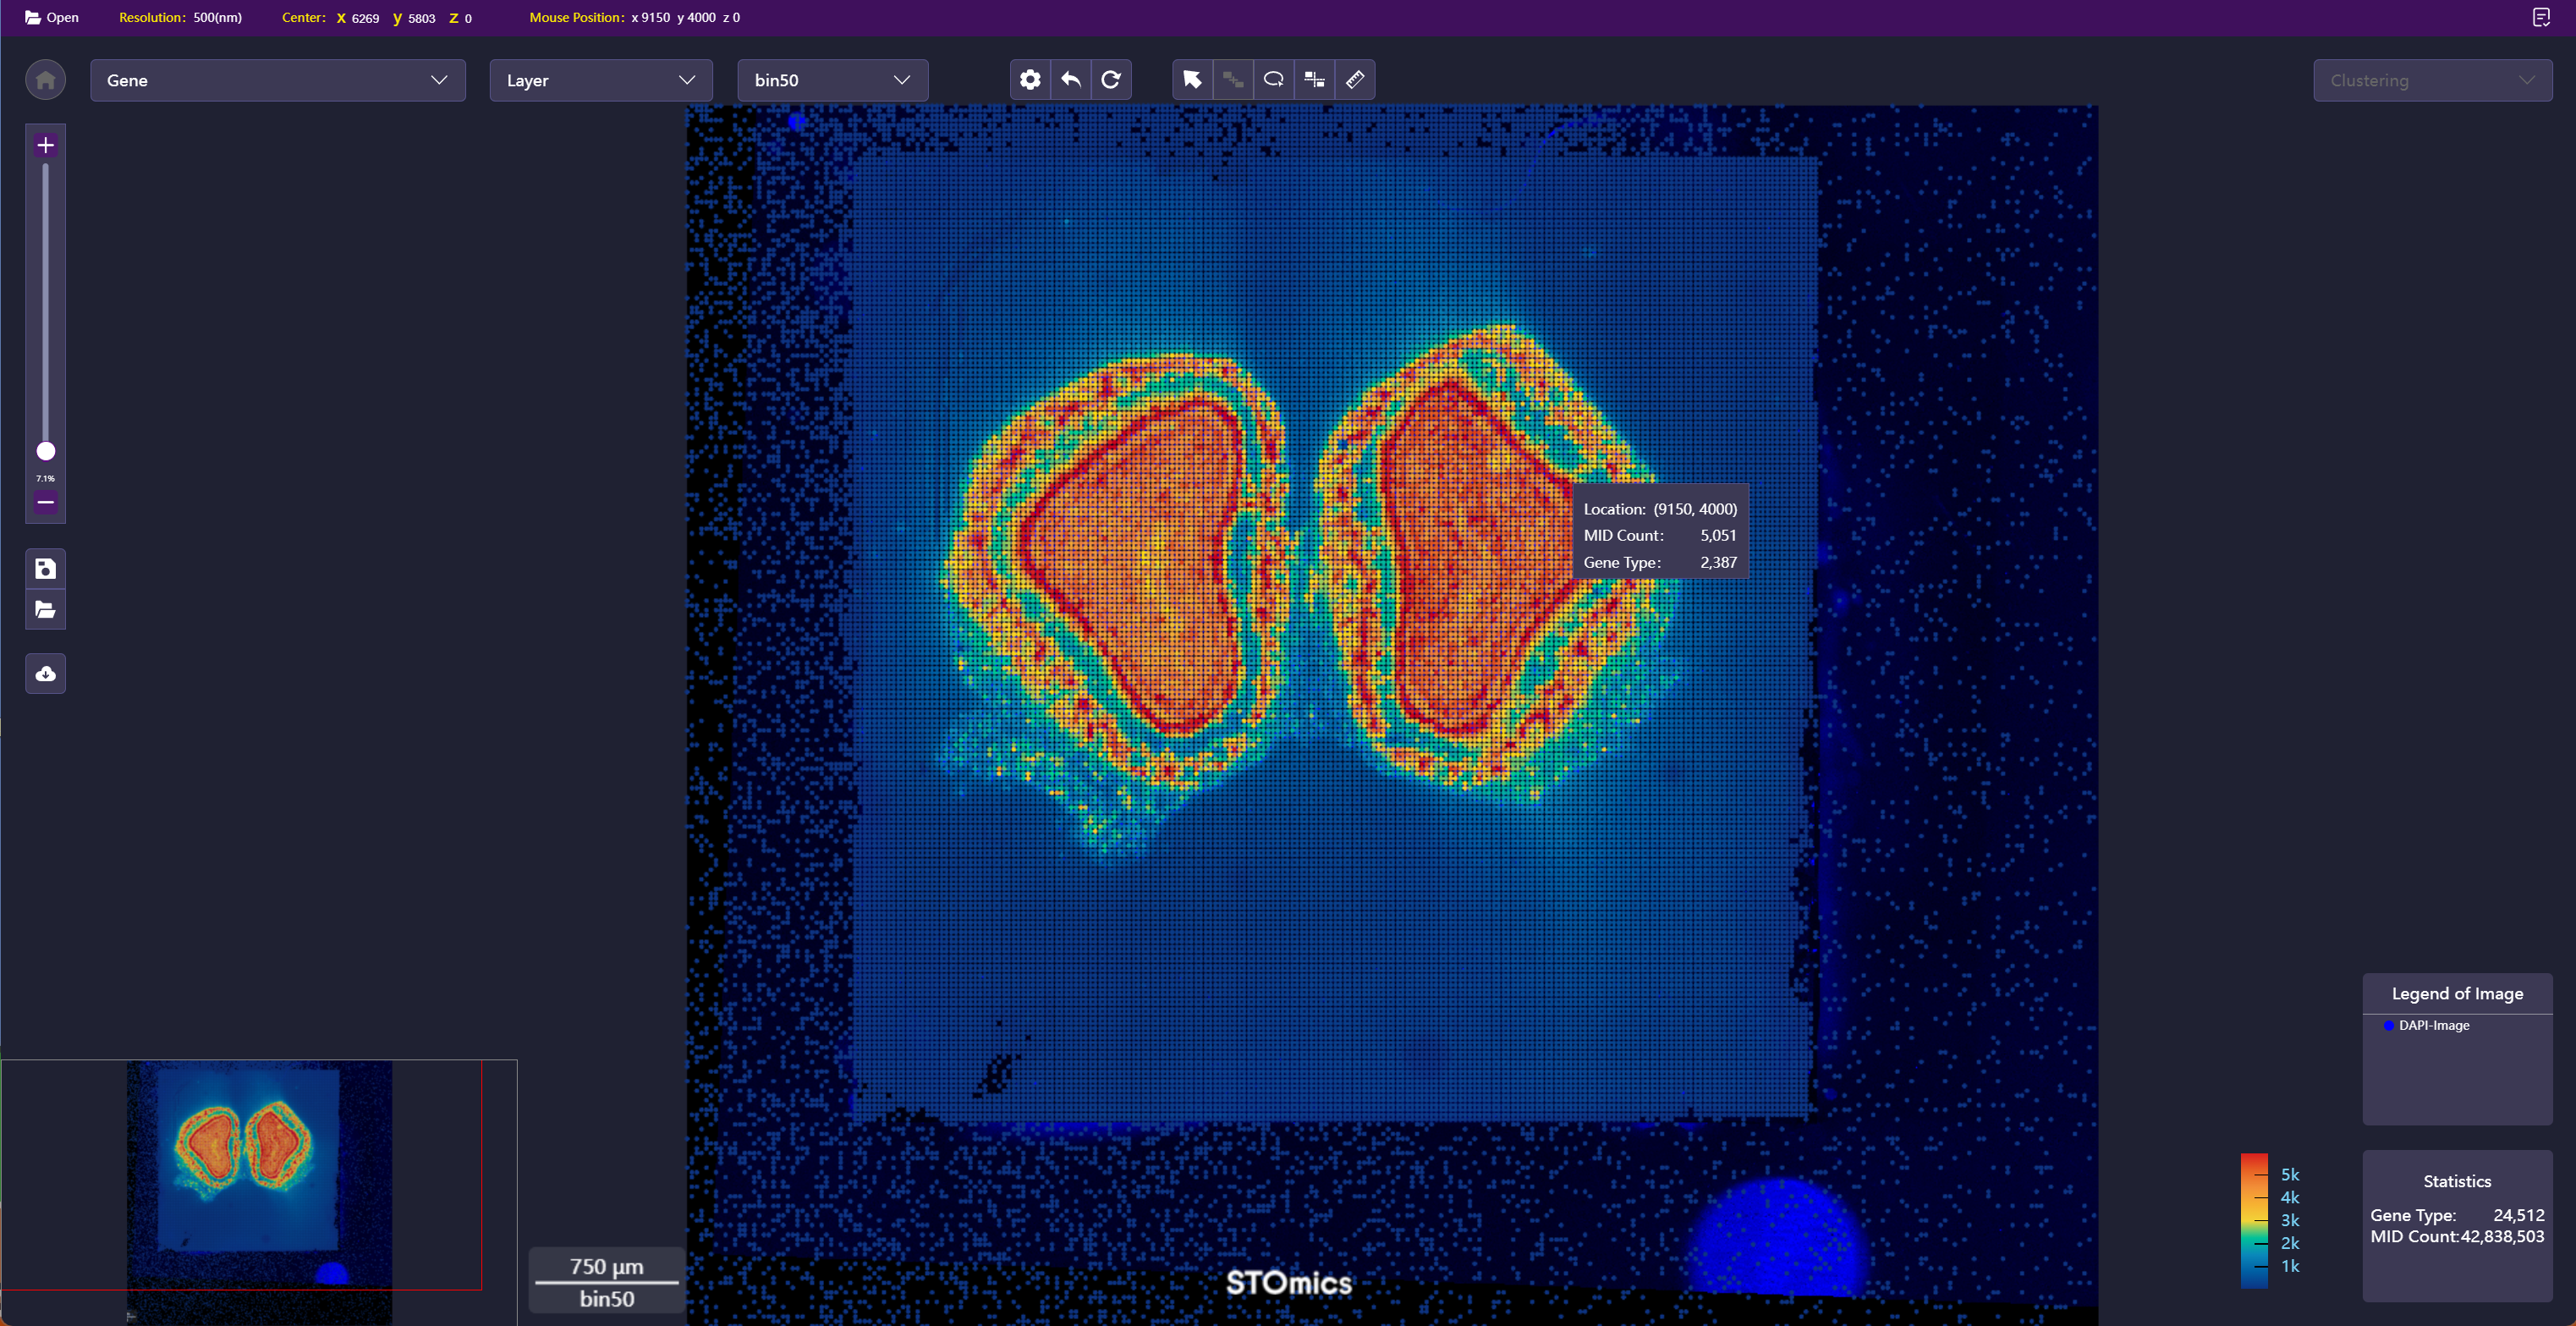
StereoMap is a high‑definition visualization tool for viewing Stereo‑seq data analysis results. It enables ultra‑high precision and ultra‑wide field display of Stereo‑seq technology, further exploring and mining spatial omics data through a variety of provided tools. GEF matrices, image RPI, IPR data, and clustering result files output from the SAW process can all be displayed in StereoMap.
StereoMap Entrance
"Task - Workflow" Module Entrance
You can select the completed SAW‑ST‑V7 task in the task list and click the "Visualization" button to enter the visualization tool.
Note
Only the following workflows support one‑click "Visualization" from Task- Workflow:
SAW-ST-V6 SAW-ST-V7

In addition to viewing Stereo‑seq data analysis results, you can also adjust and submit analysis tasks in real‑time in "Visualization" to obtain better results. Currently, manual registration and manual lasso are supported.
"Interactive Analysis" Entrance
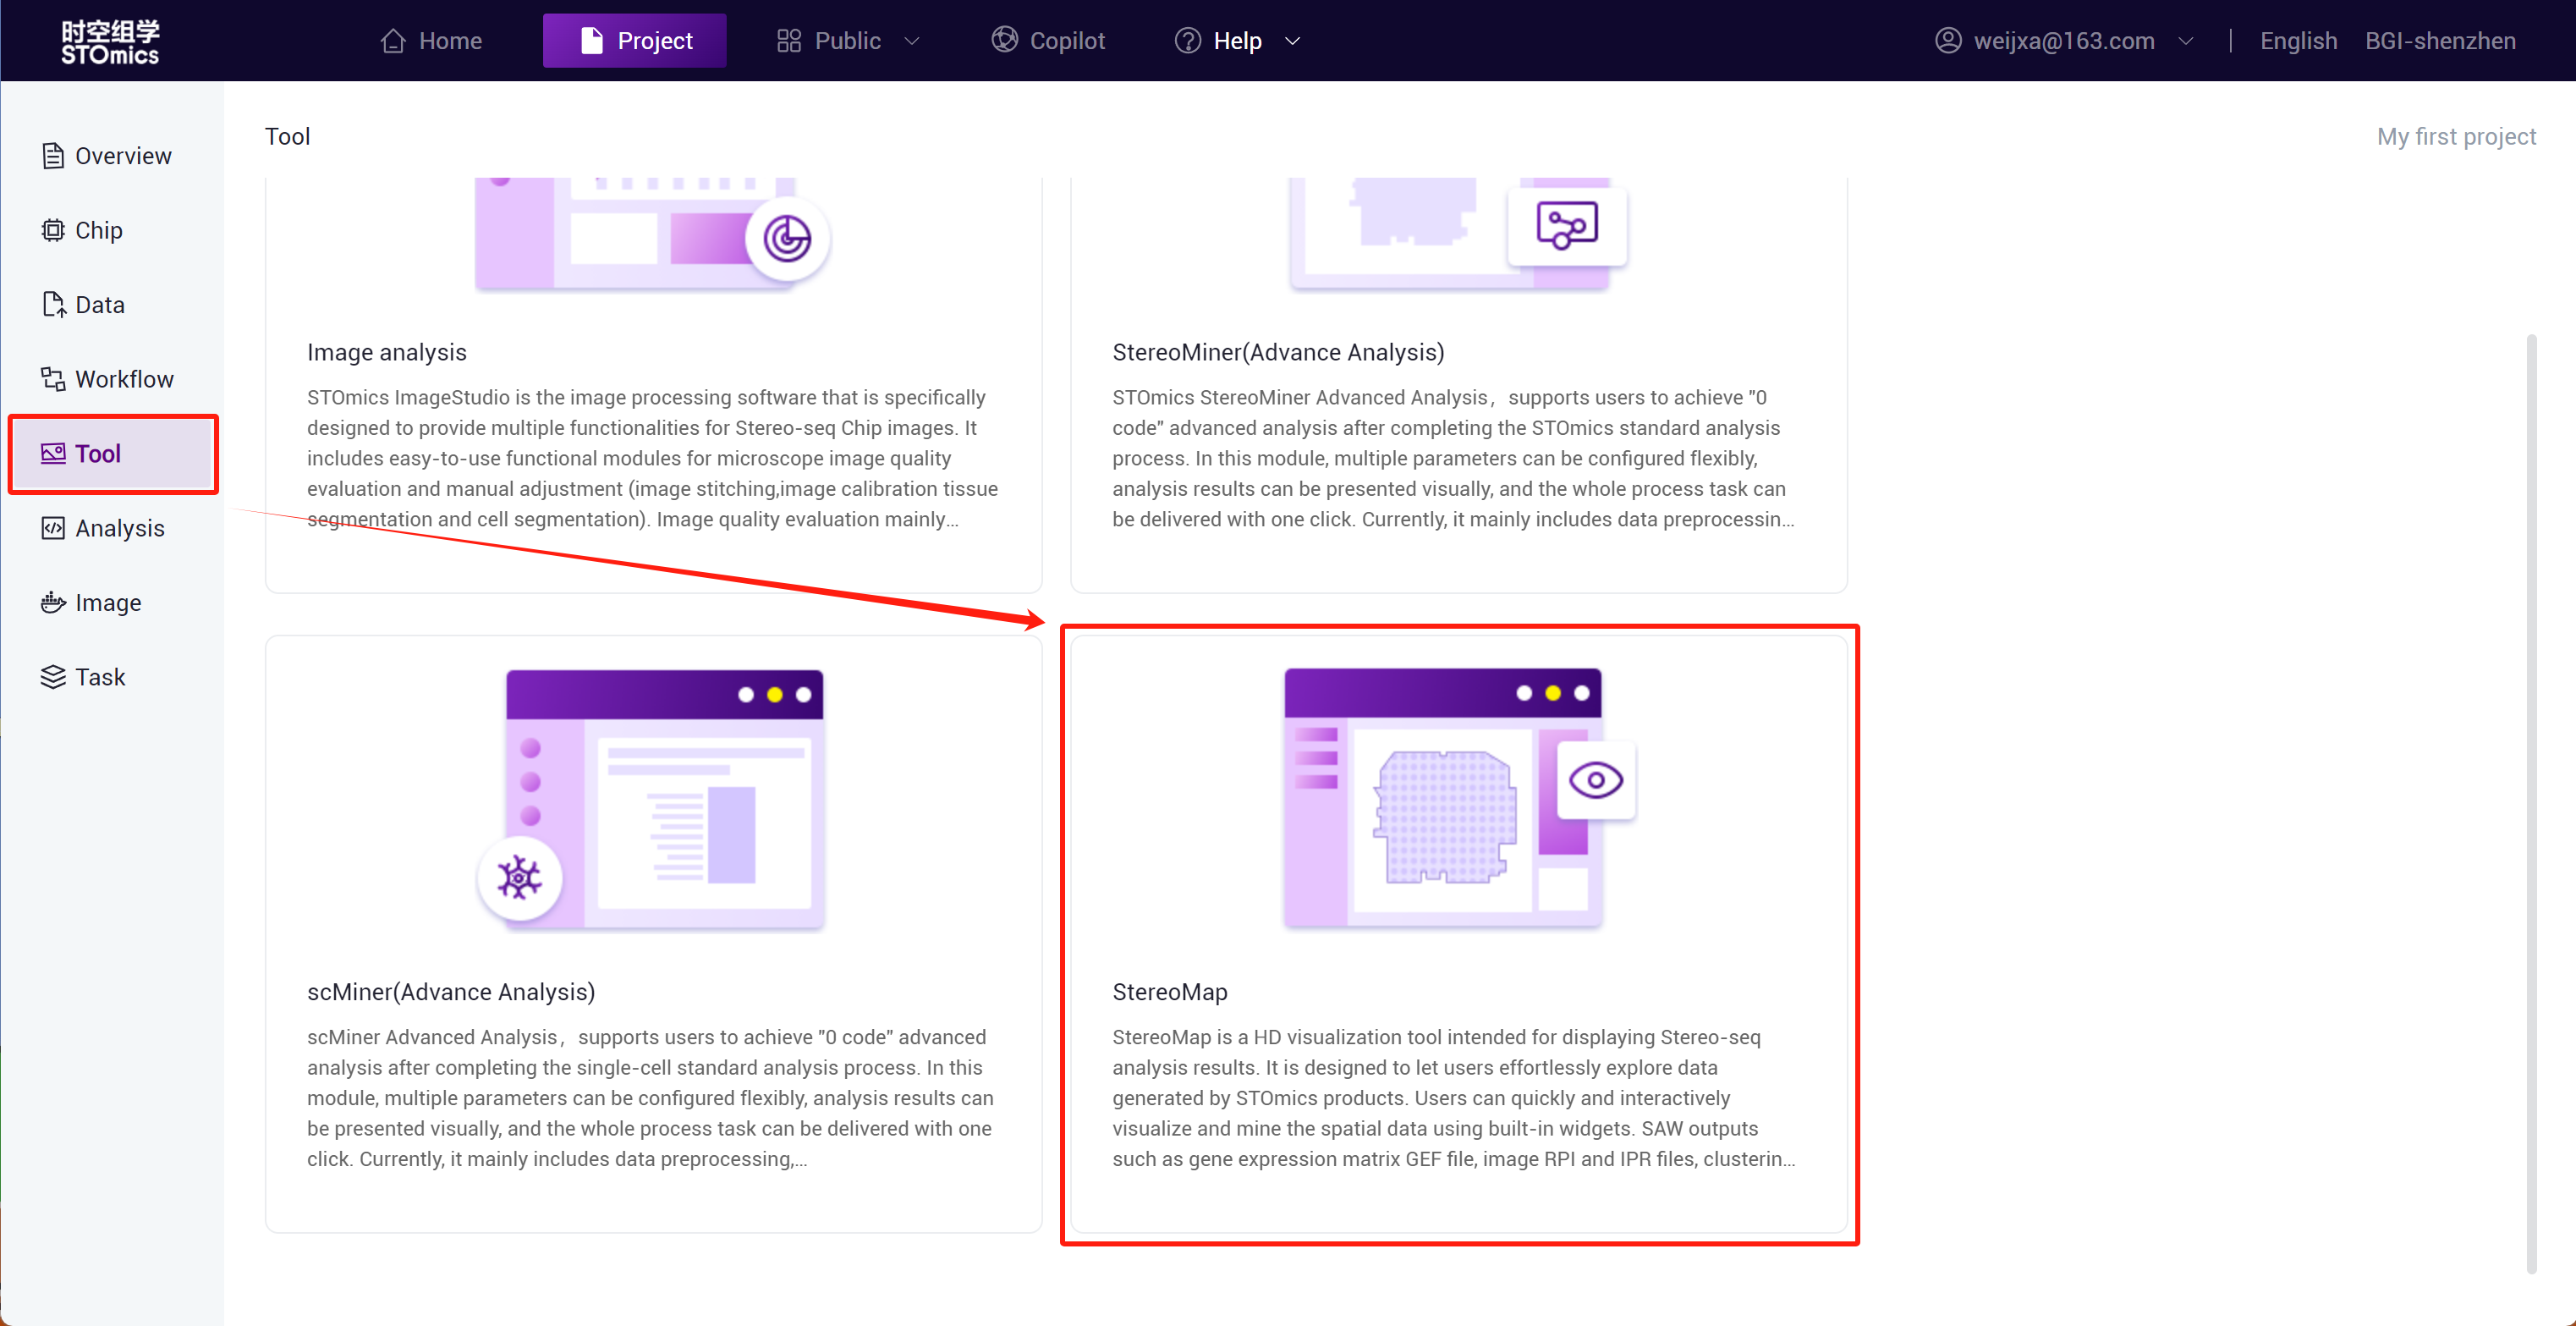
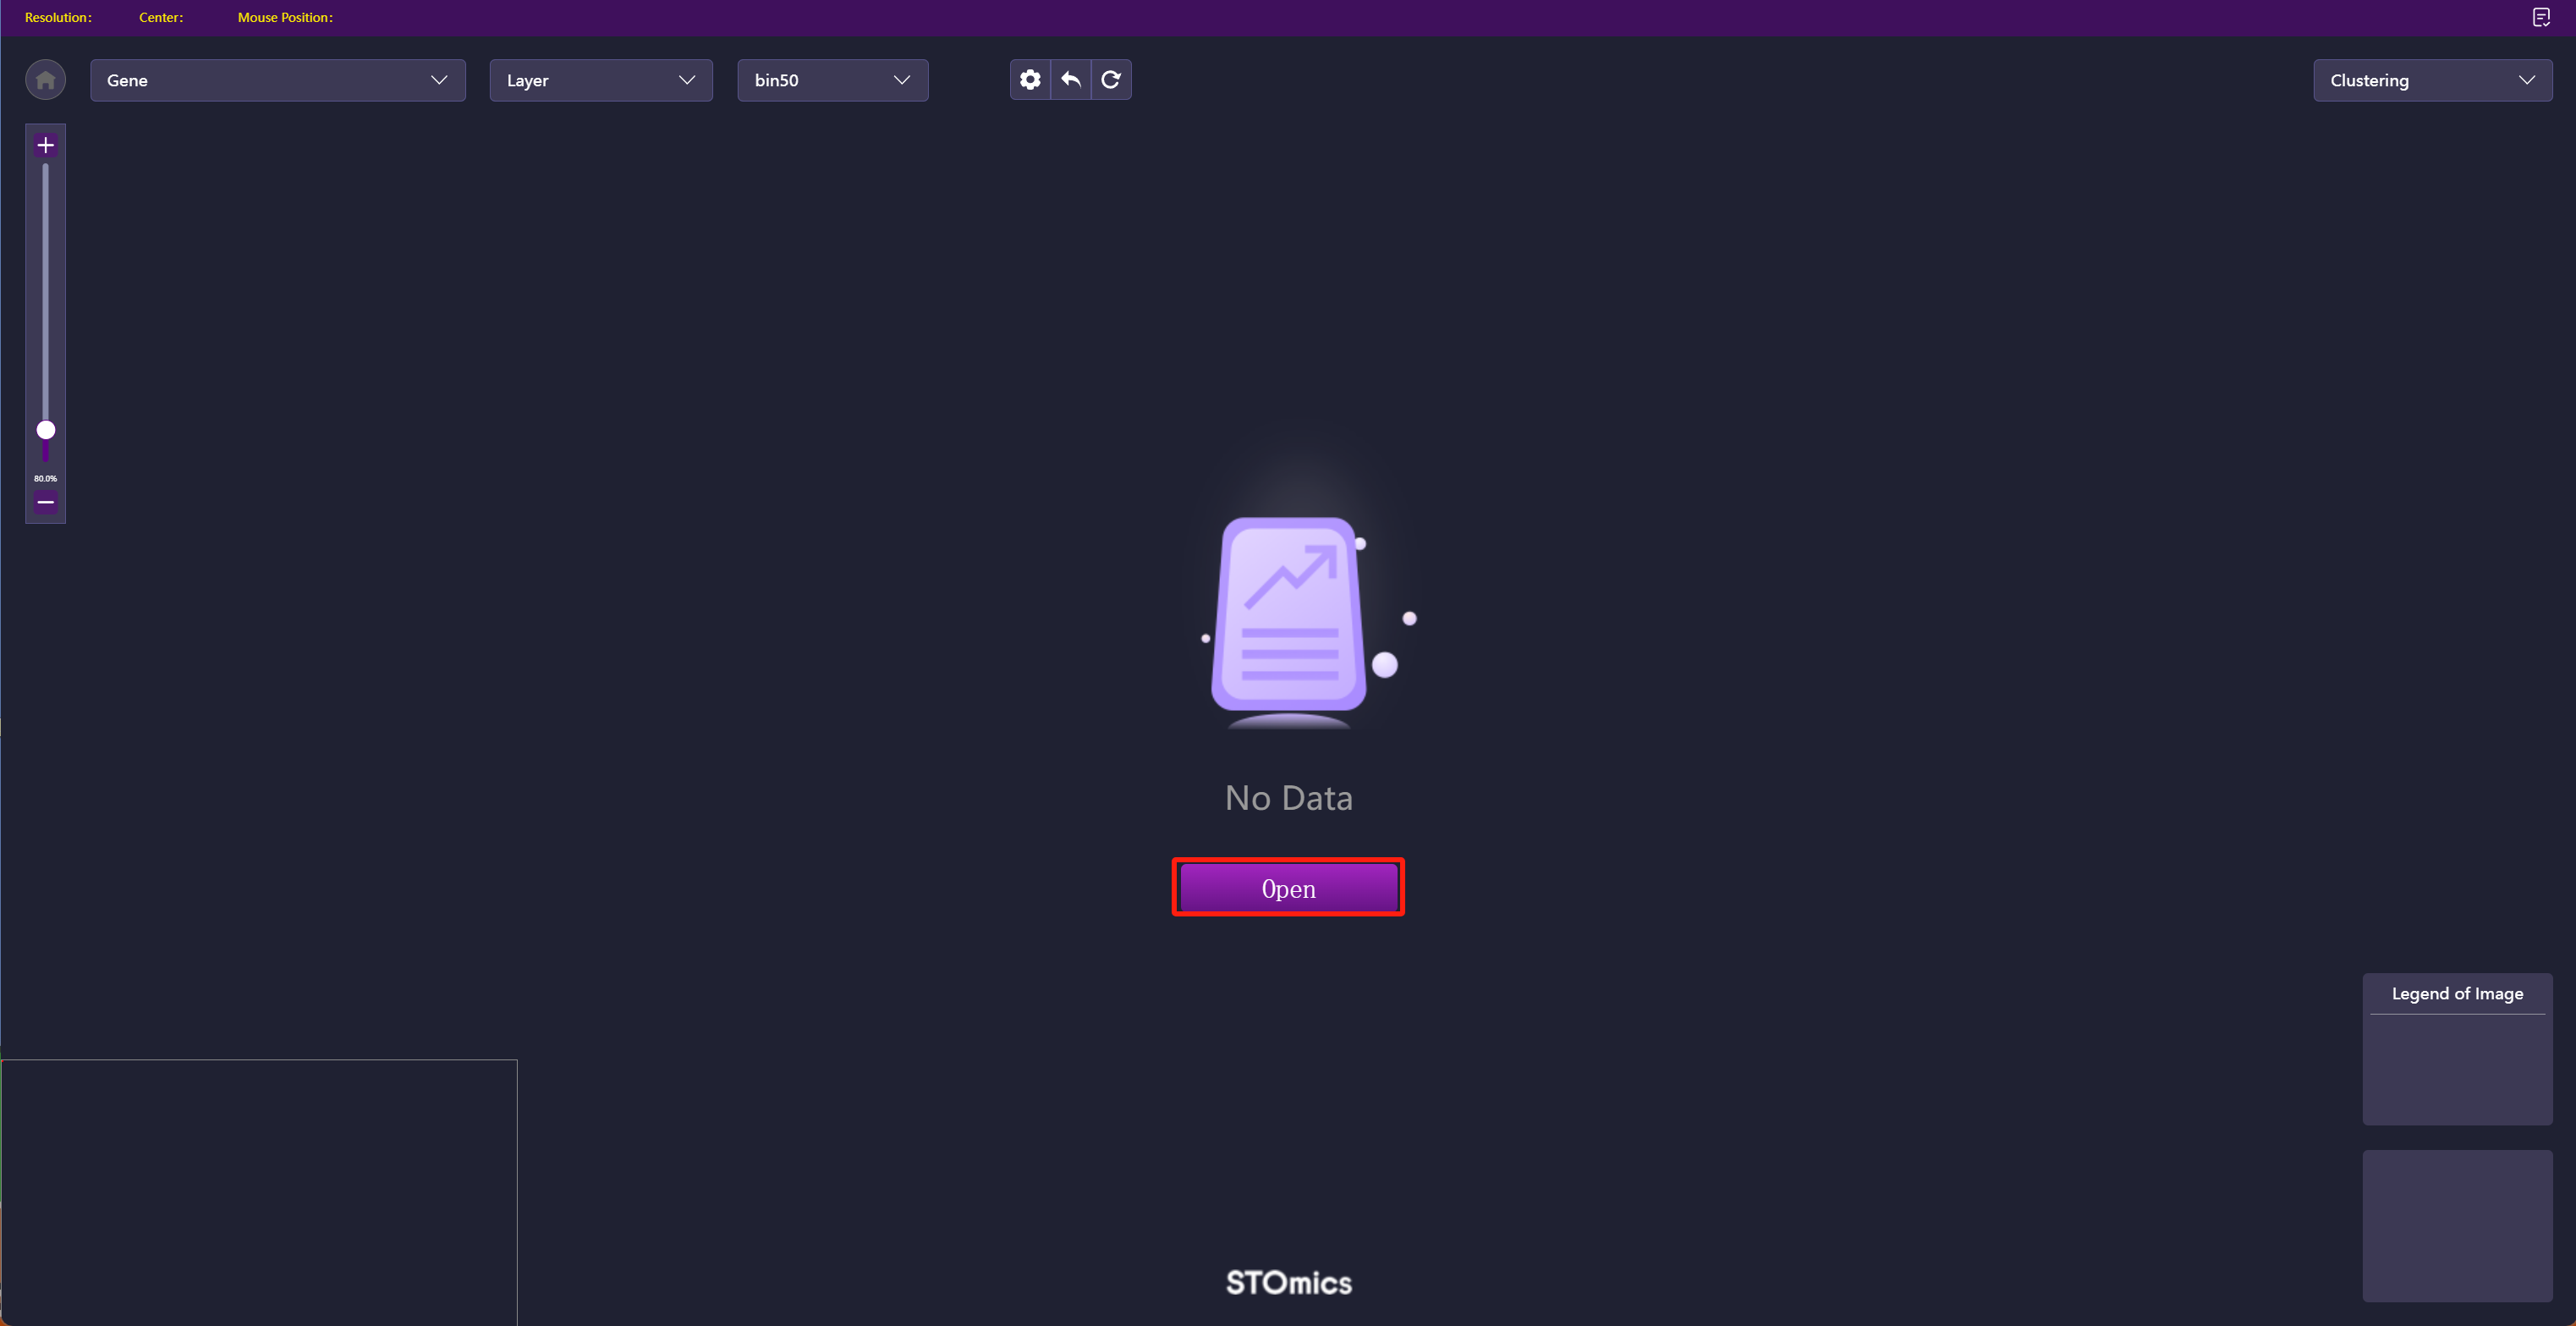
Step1: Enter the project and click "StereoMap" under Tool to enter the visualization tool.
Step2: Click "Open" and select data.
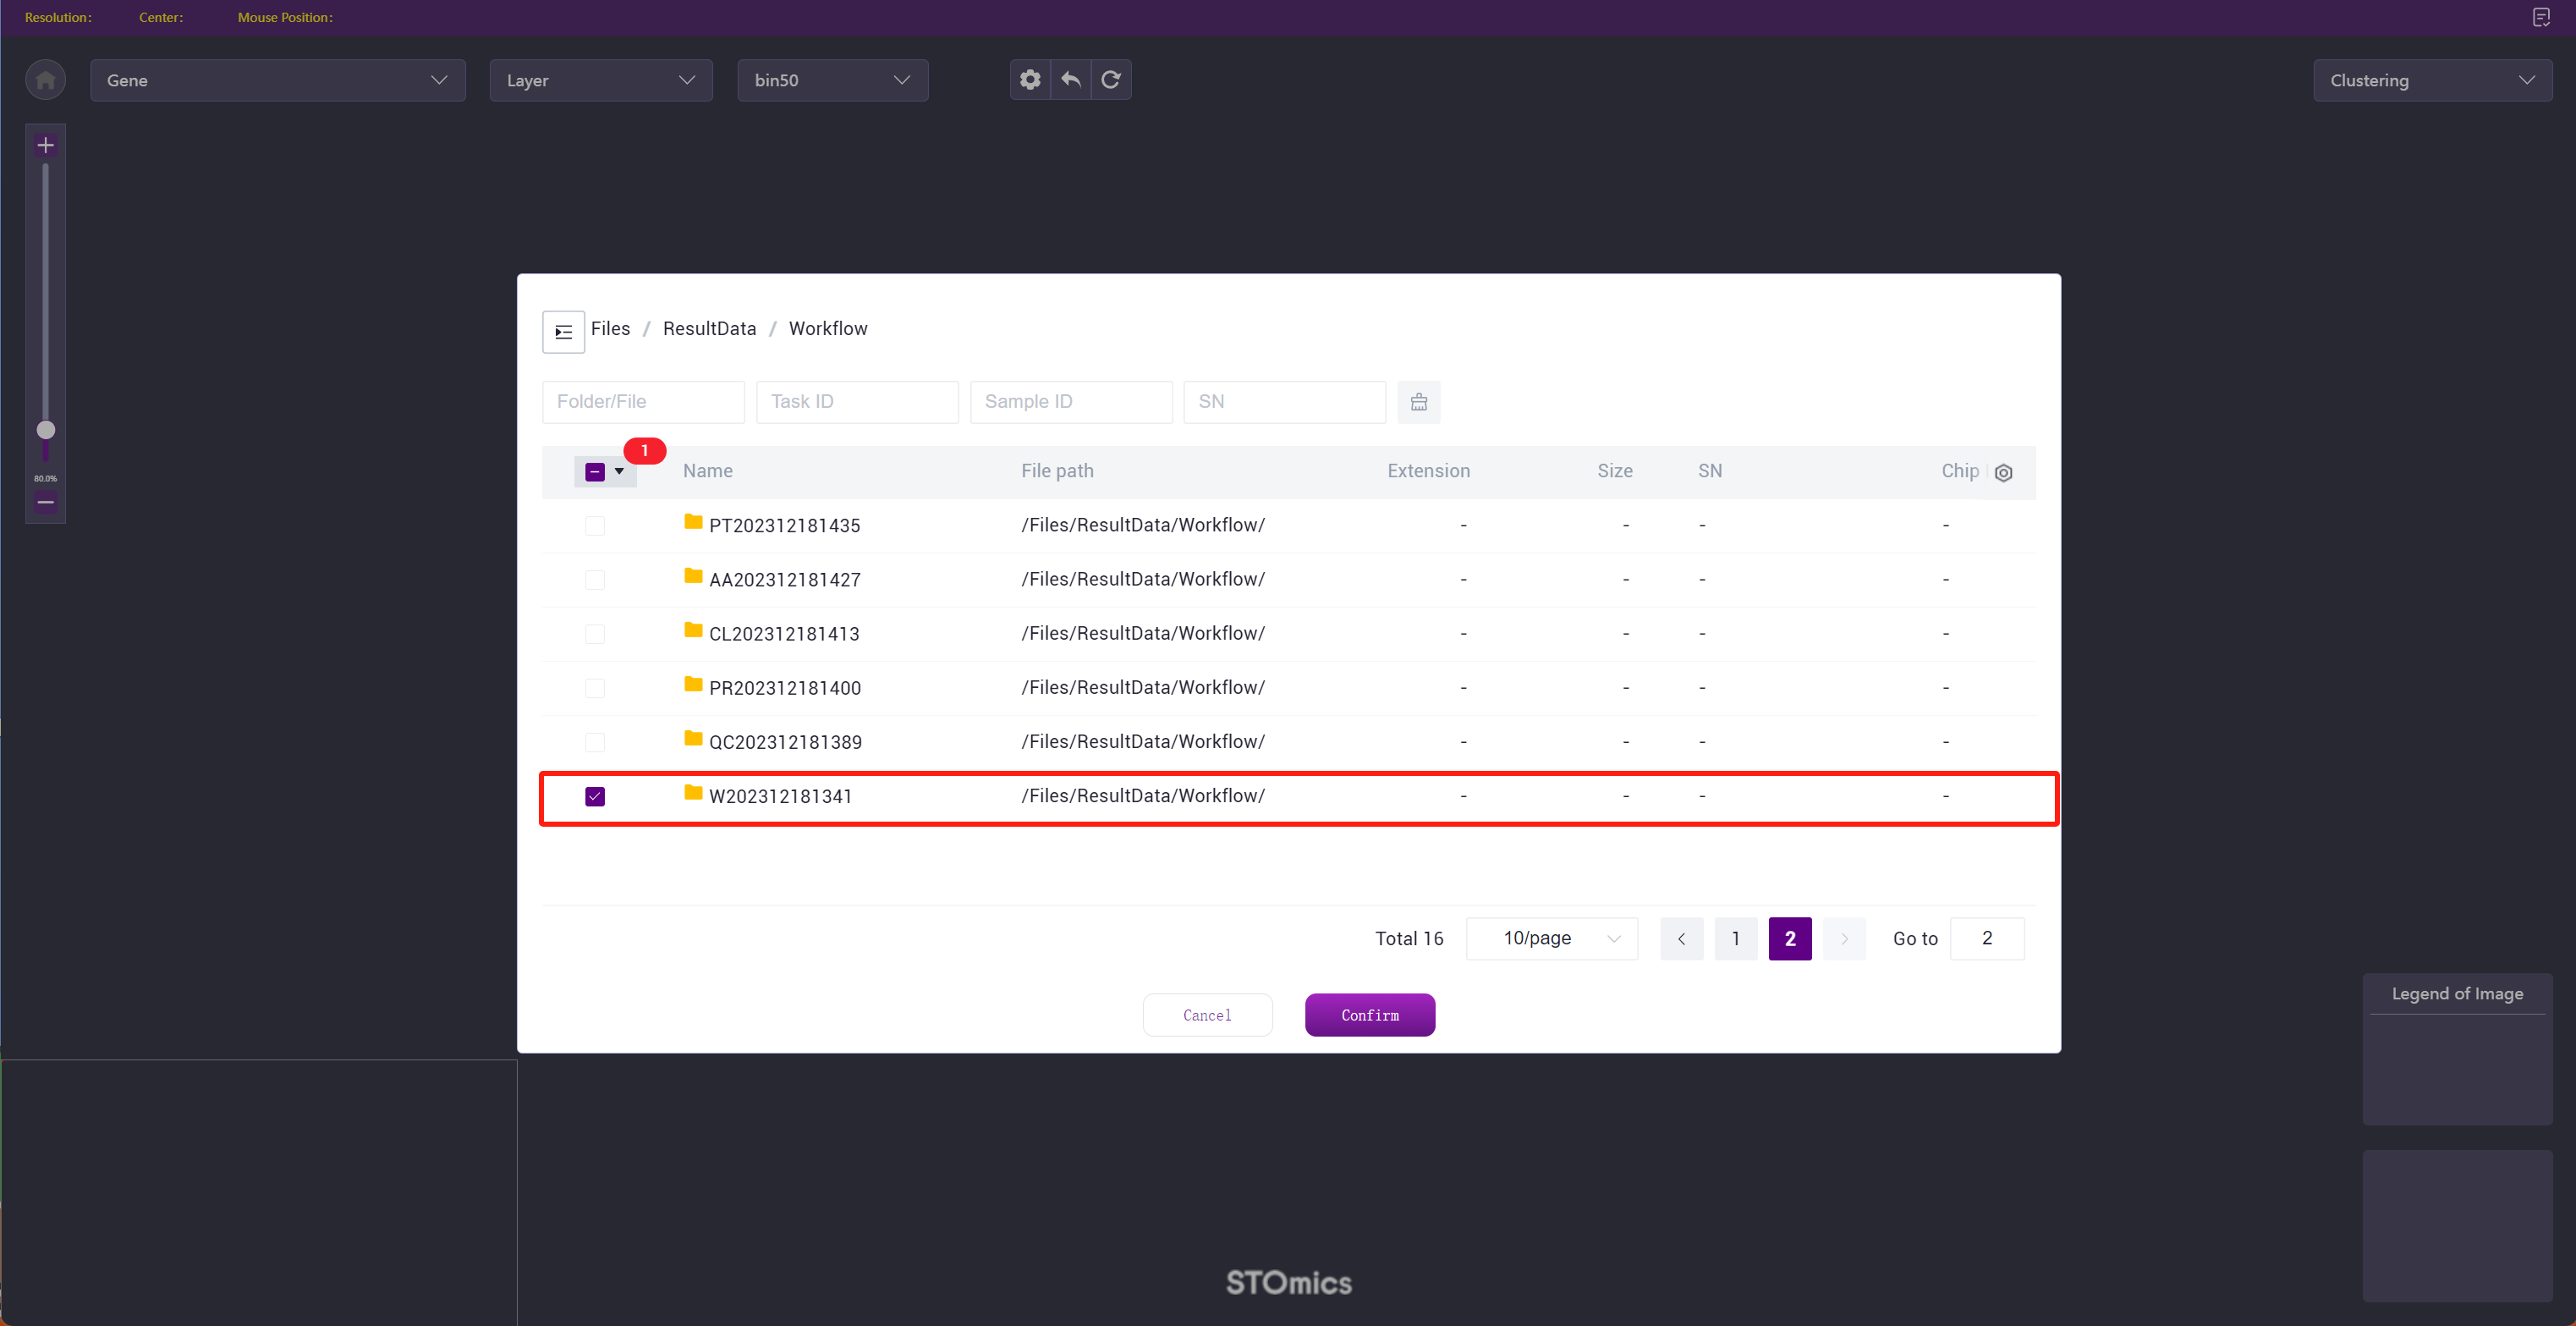
Step3: Choose the data as needed, support selecting a file or folder, confirm after selection.
View Results
You can view the task running status in real‑time in the project Task module.
View all analysis task results in the Data /Files/ResultData/Workflow/ directory.