Tool
Tool
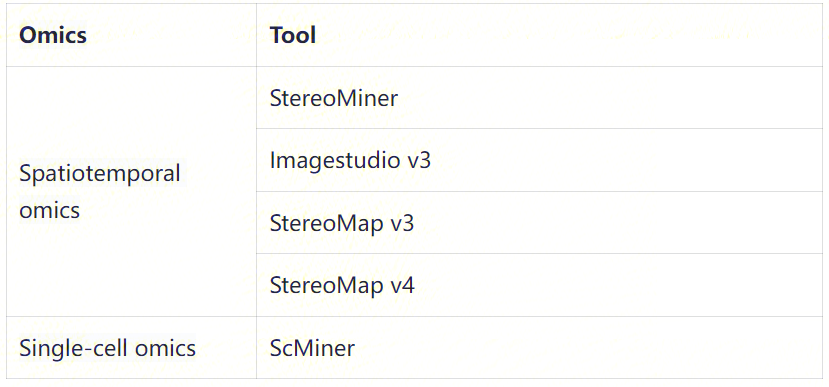
Interactive analysis supports the retrieval and use of various customized tools and personal tools, meeting the usage requirements of different user scenarios. Currently, it includes multiple interactive tools: image analysis, visualization, spatiotemporal advanced analysis, single-cell advanced analysis**.**
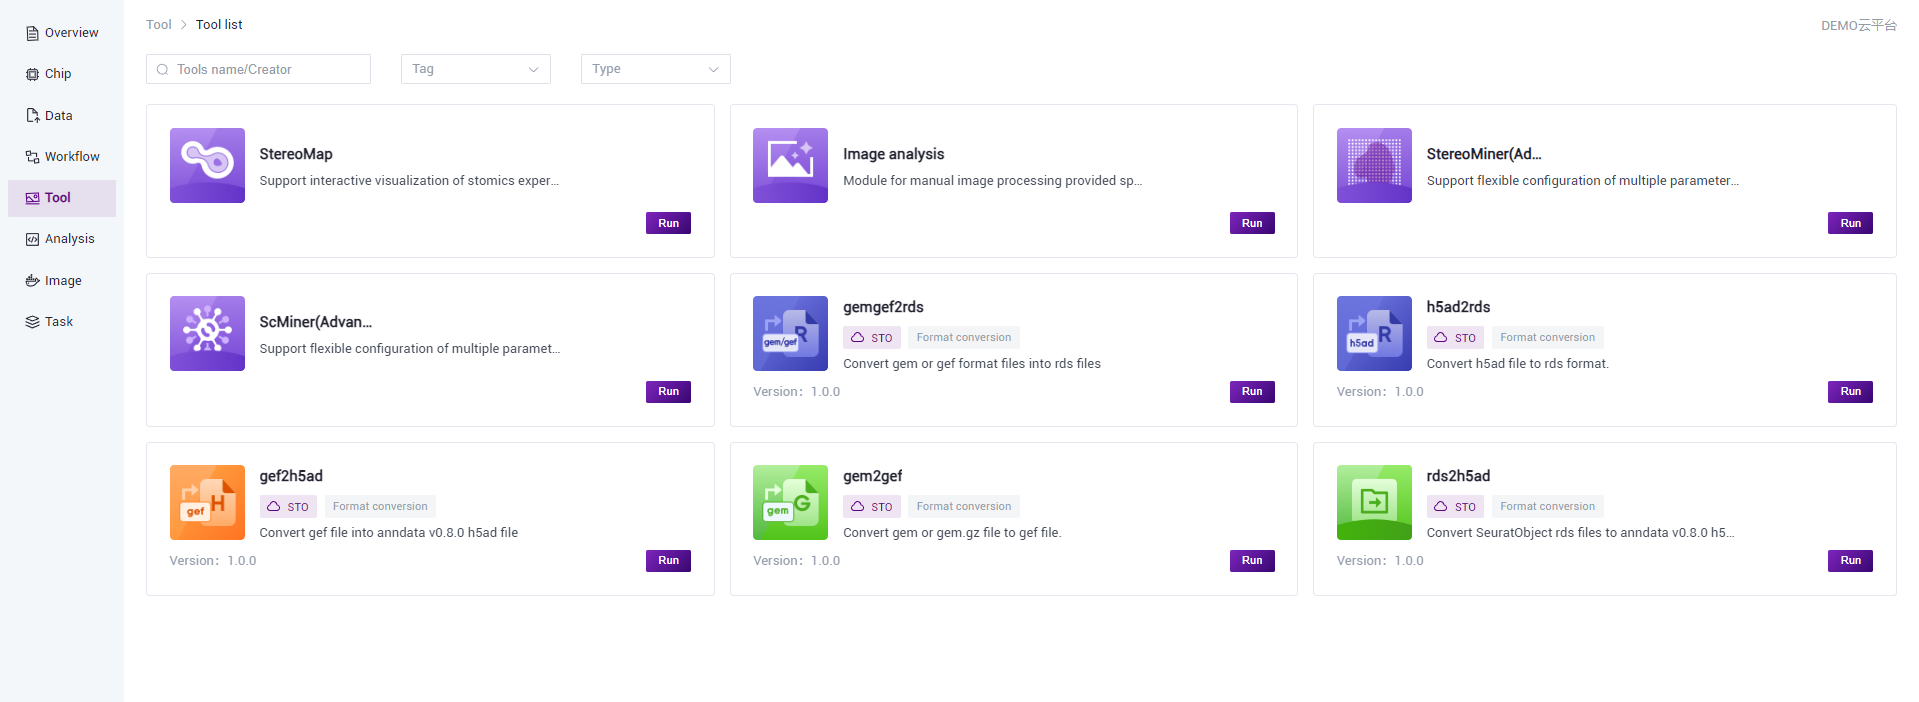
For different omics analysis scenarios, the cloud platform provides users with various interactive analysis tools. Users can copy the desired tools from the public library > public applications > tools to their projects based on their analysis needs. The list of public interactive tools is as follows:
Detailed tutorials for using the above tools can be found in the "Tool Tutorials" section of the Help Center.
Add tools
The DCS Cloud supports two ways to add tools: 1. Copying from the public library, 2. Creating online
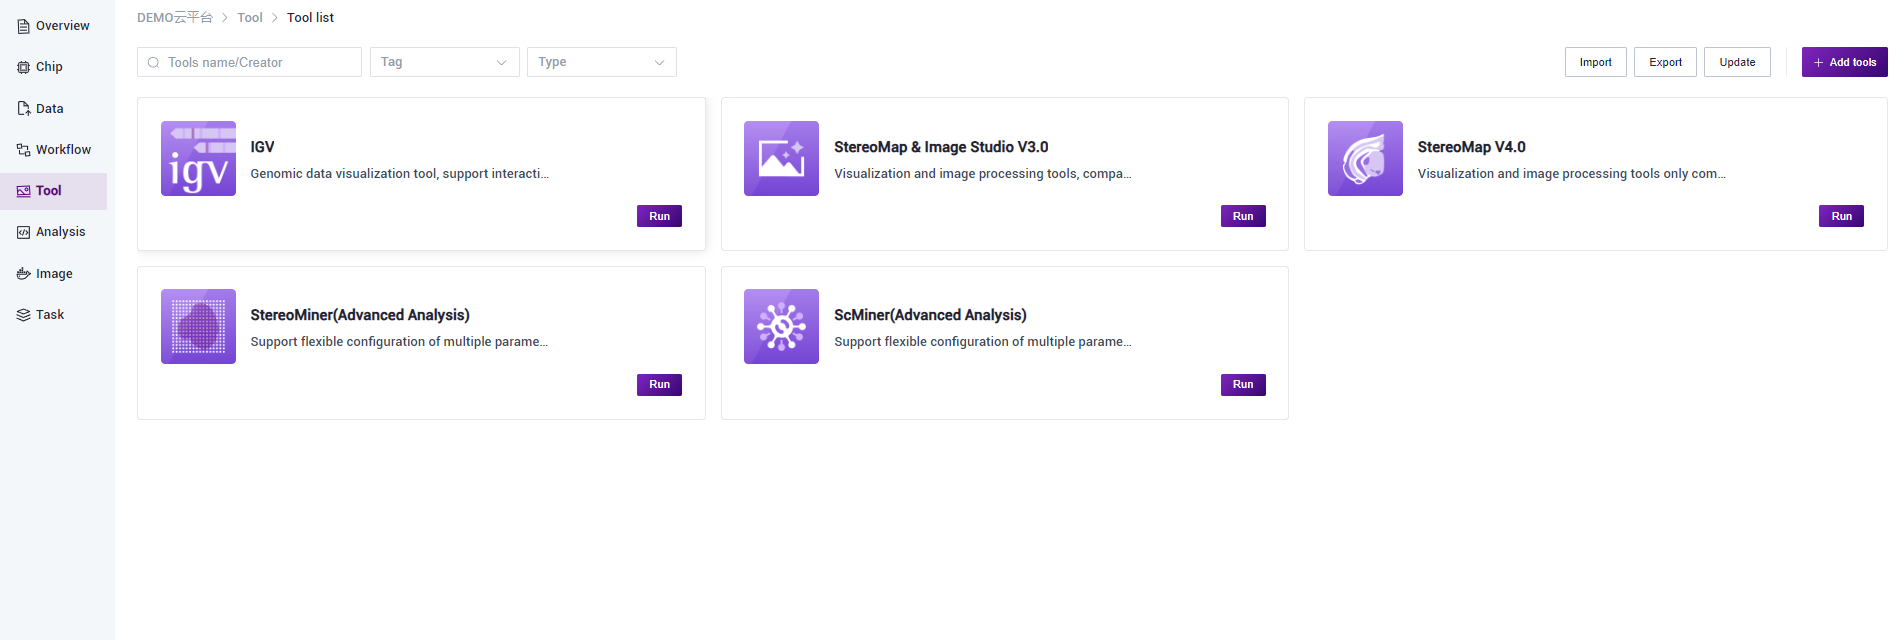
Copy from library
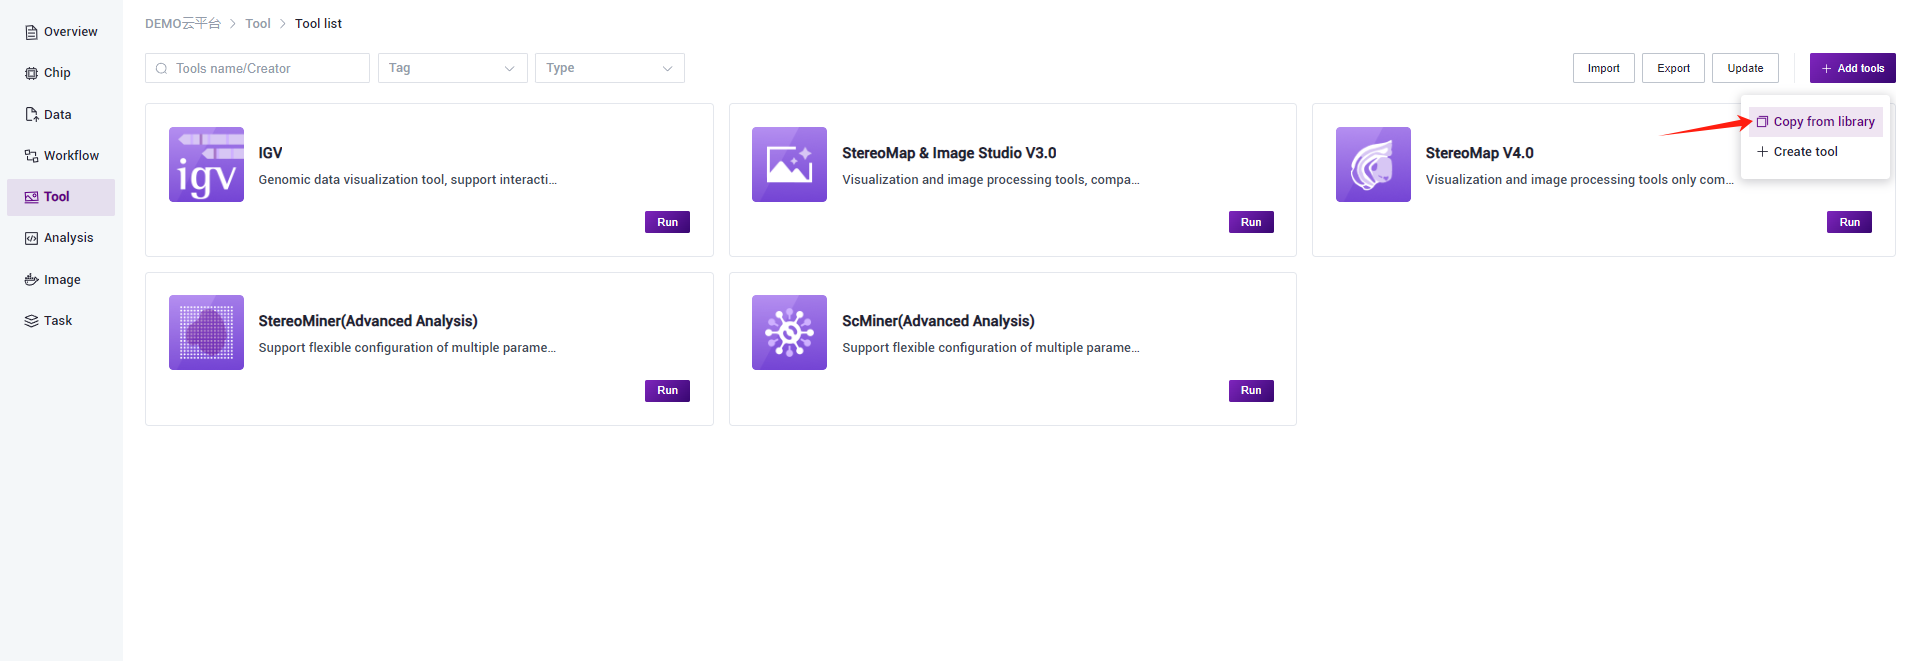
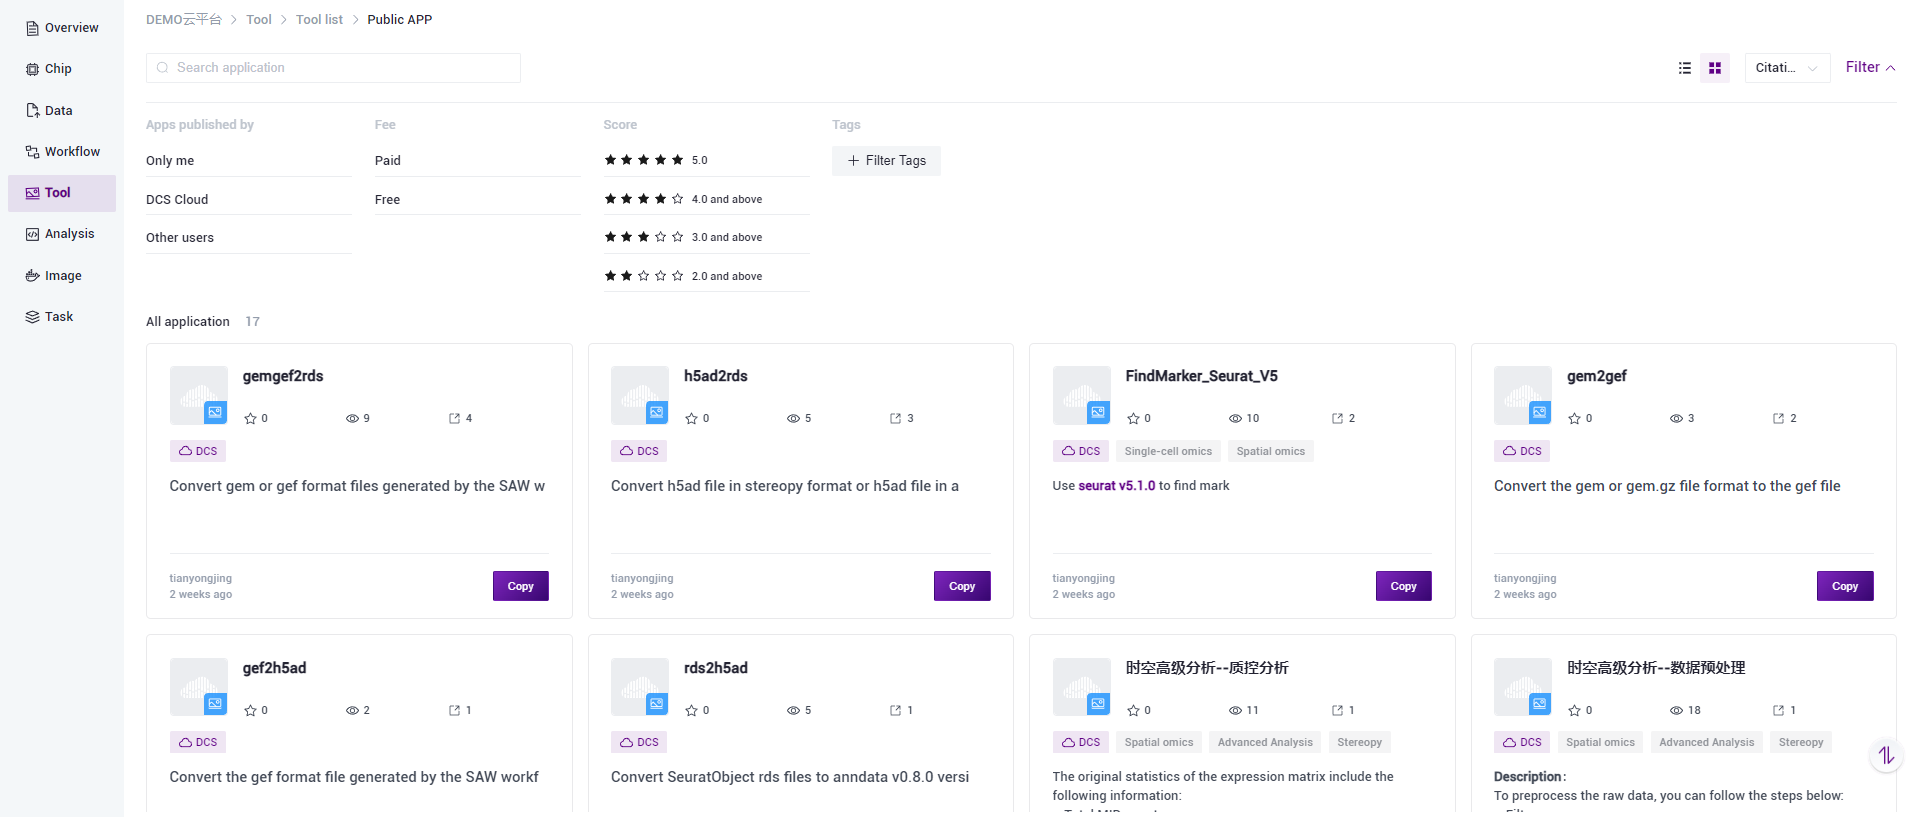
To add a new tool for interactive analysis in your personal project, you can click on the "Add Tool" button and then select "Copy from Public Library" to display the page with the available tools that can be copied from the public library. From there, you can choose the desired tool and copy it to your project for use.
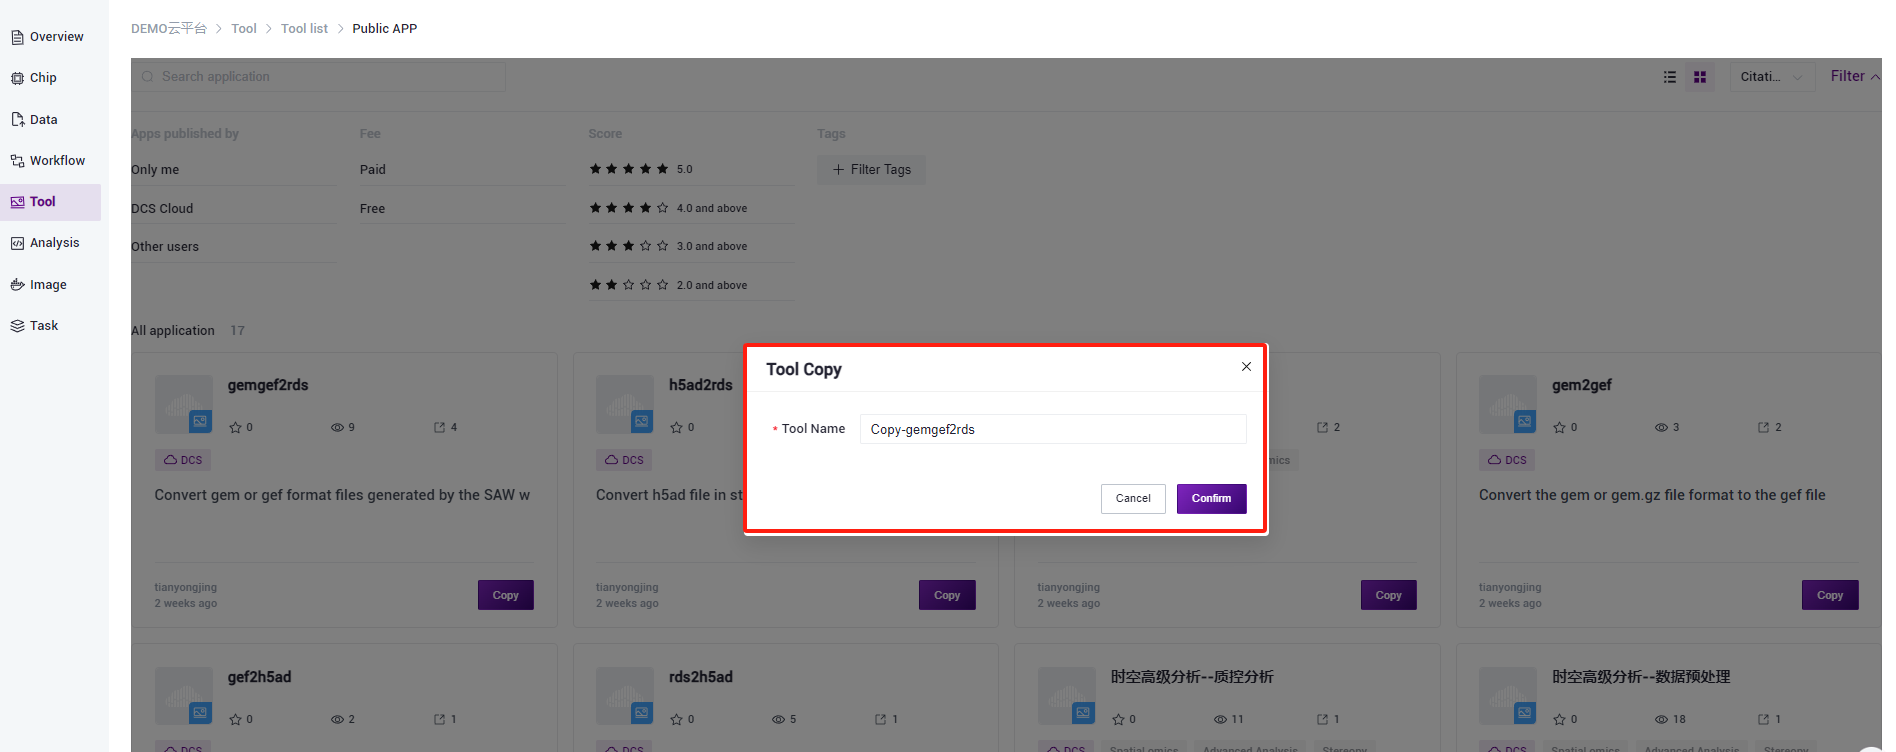
To select the desired tool, you can modify the tool name if needed. Click on "Confirm" to copy the tool to your project for use
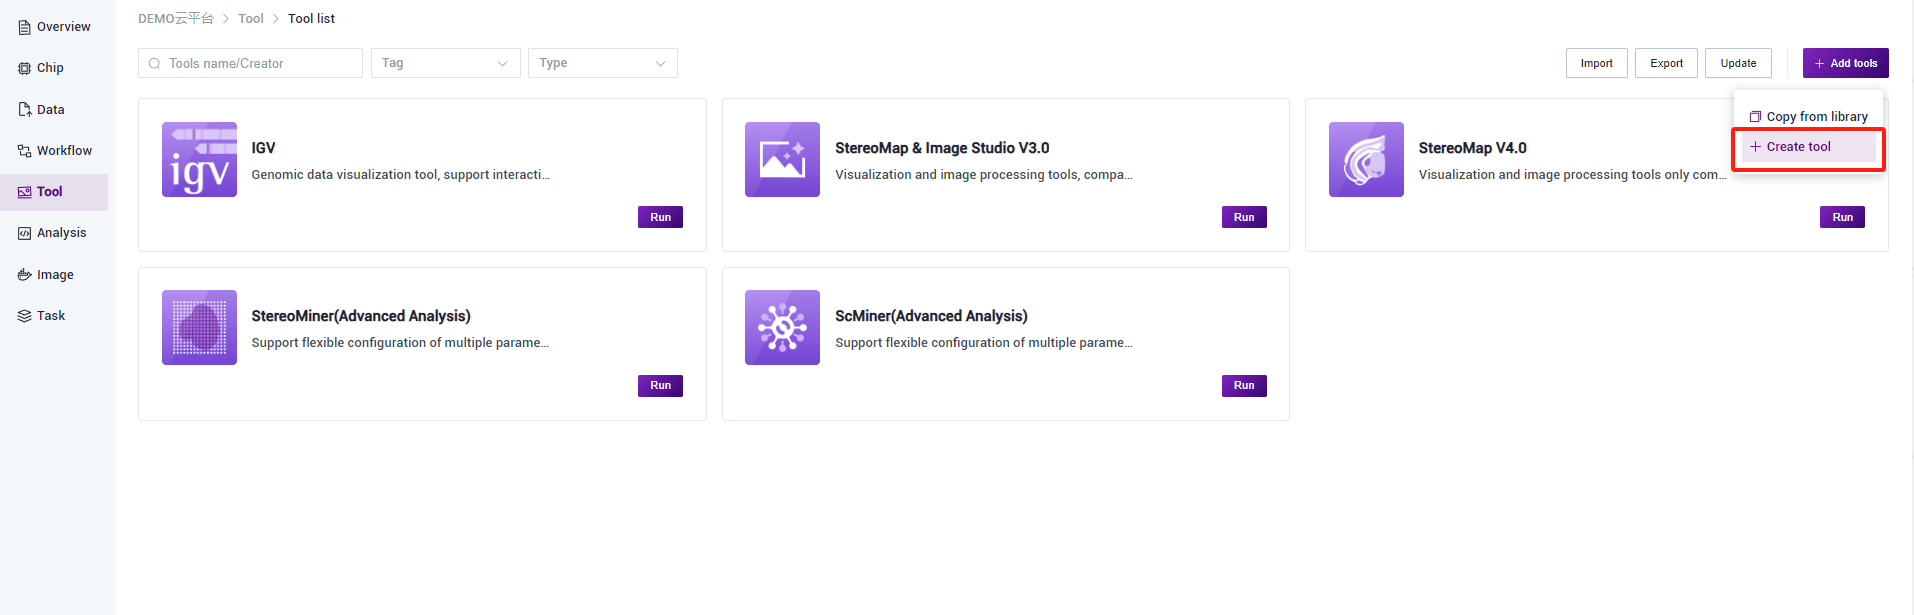
Create tool
- Click on "Add tools" > "Create tool" to allow developers to create tools on their own
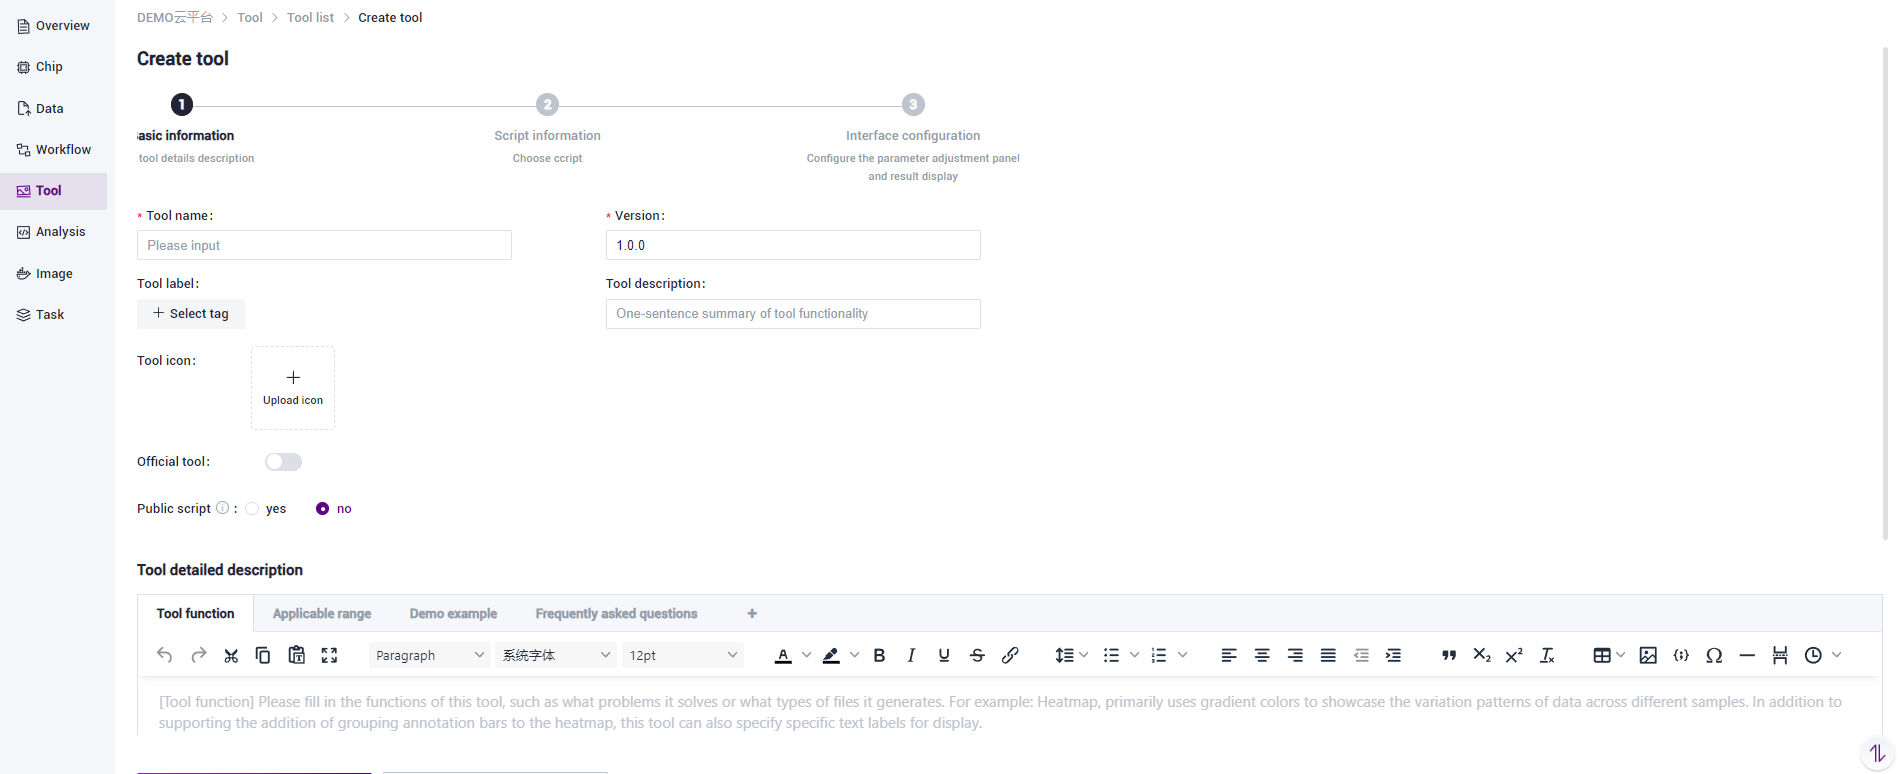
- Creating a new tool involves three steps: in the first step, you provide basic information about the tool. Follow the prompts to fill in the required information, including the tool name and tool version. The tool's initial version number is set to 1.0.0 by default, and the remaining information is optional.
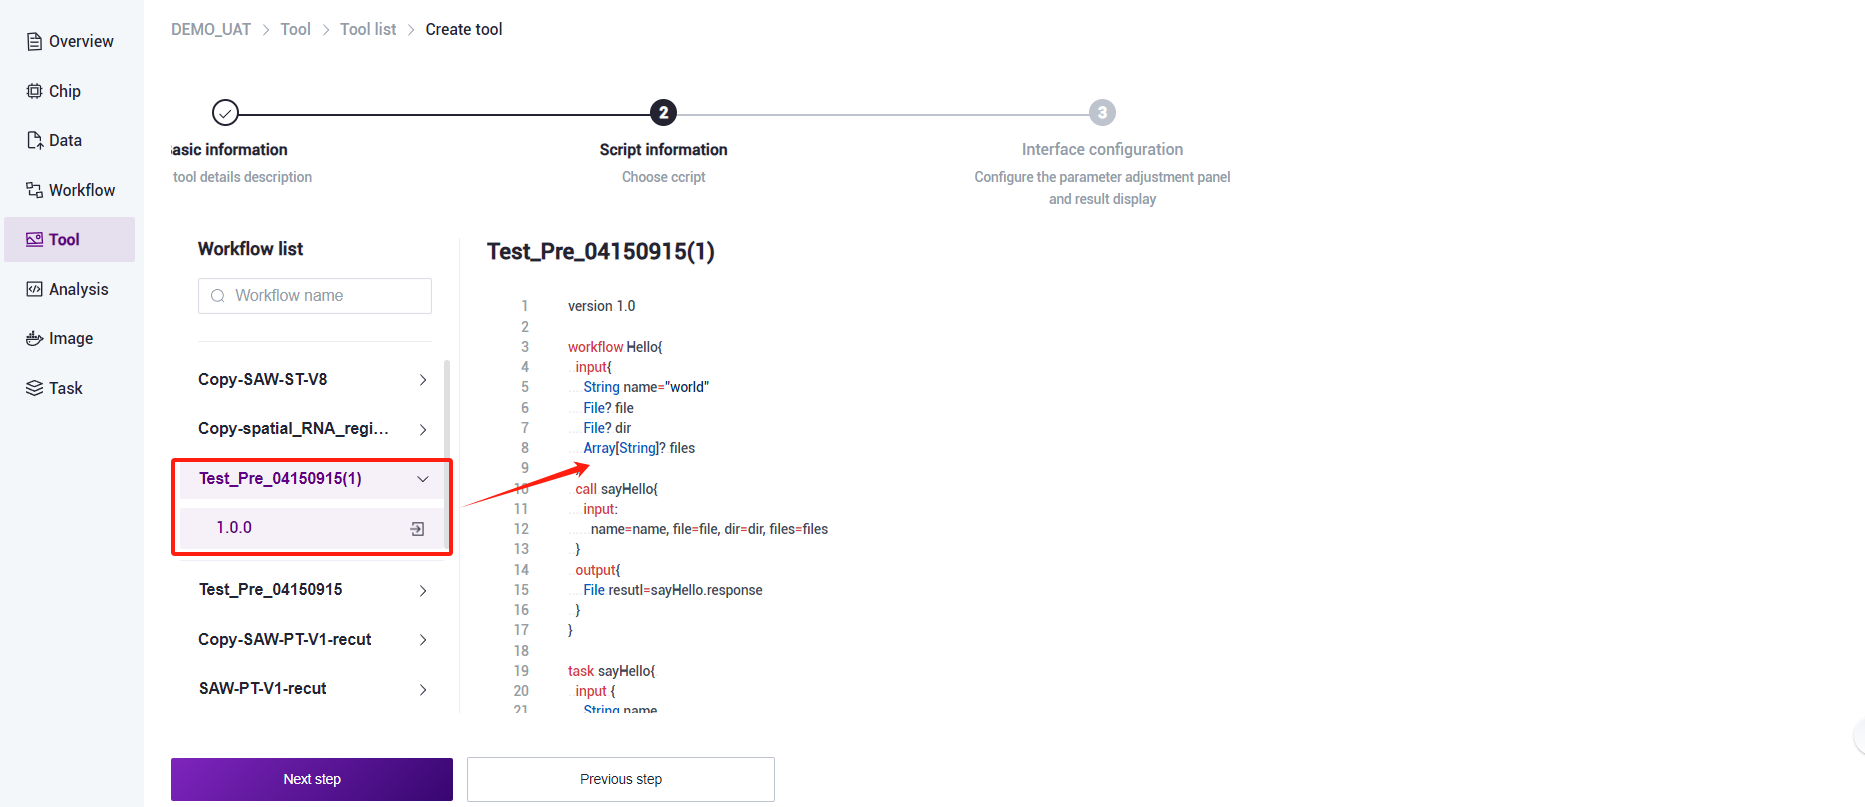
- In the second step of tool creation, you will enter the script information. The left column will display a list of all the process names in the project's workflow analysis module for which you have permission to edit scripts.
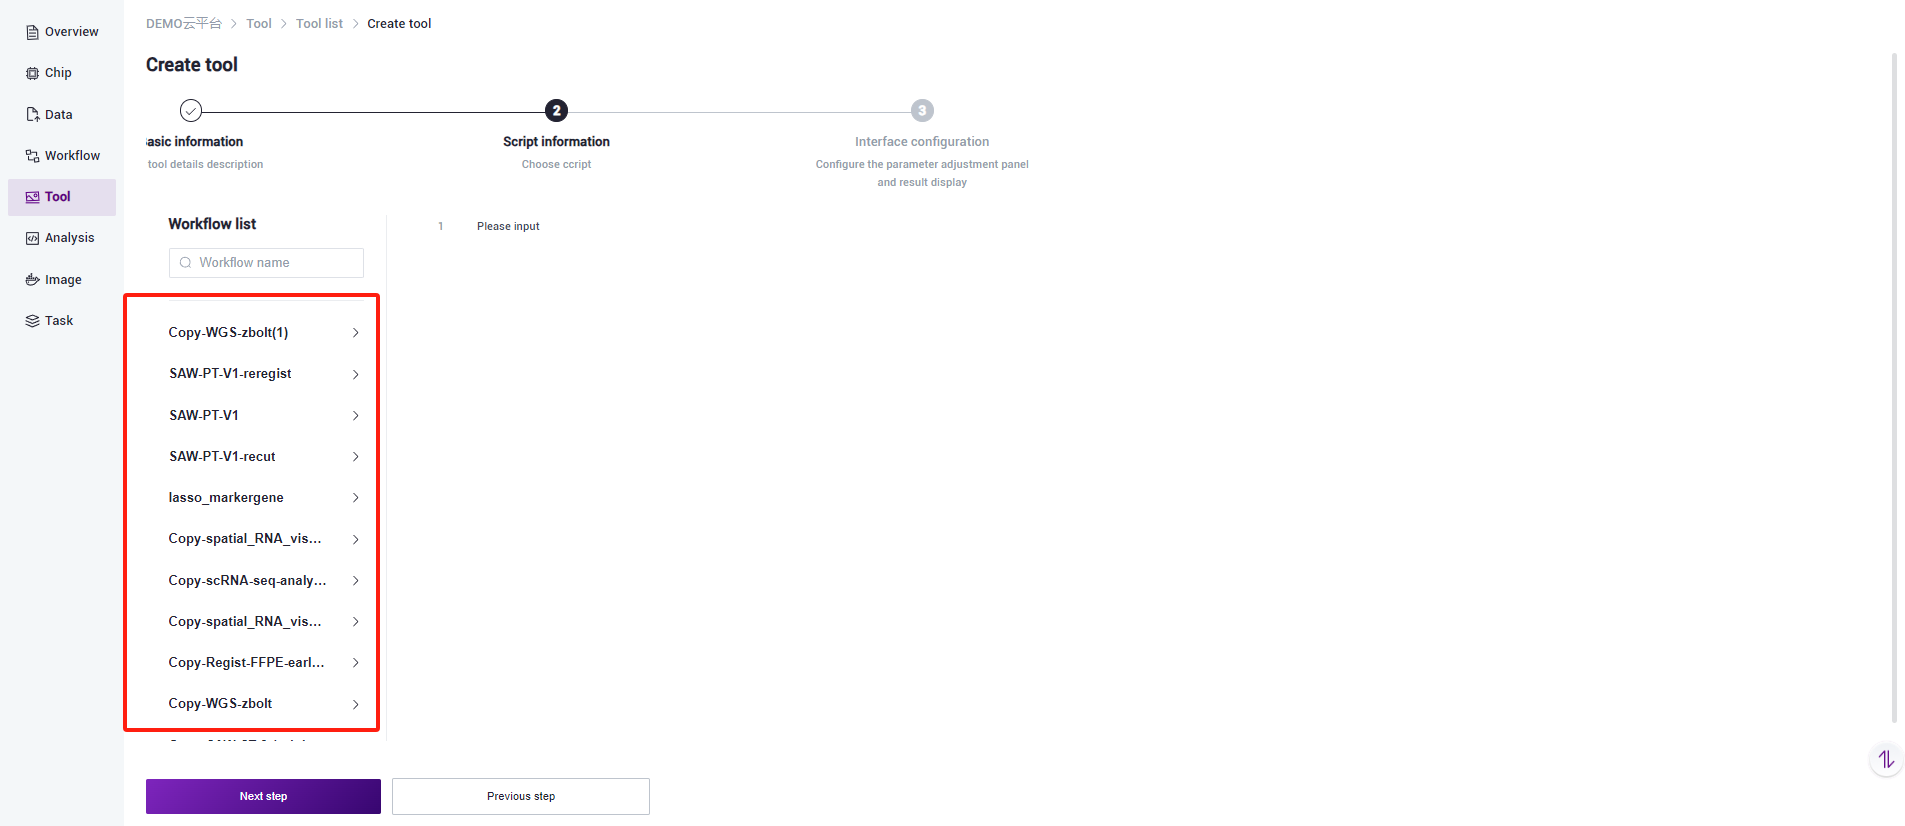
- To select the required process script for the tool, click on the version to fill it in the script area.
- Click "Next" to proceed to Step 3 of creating a widget: Interface Configuration (the interface presented to user-side operations) to complete the selection of components.
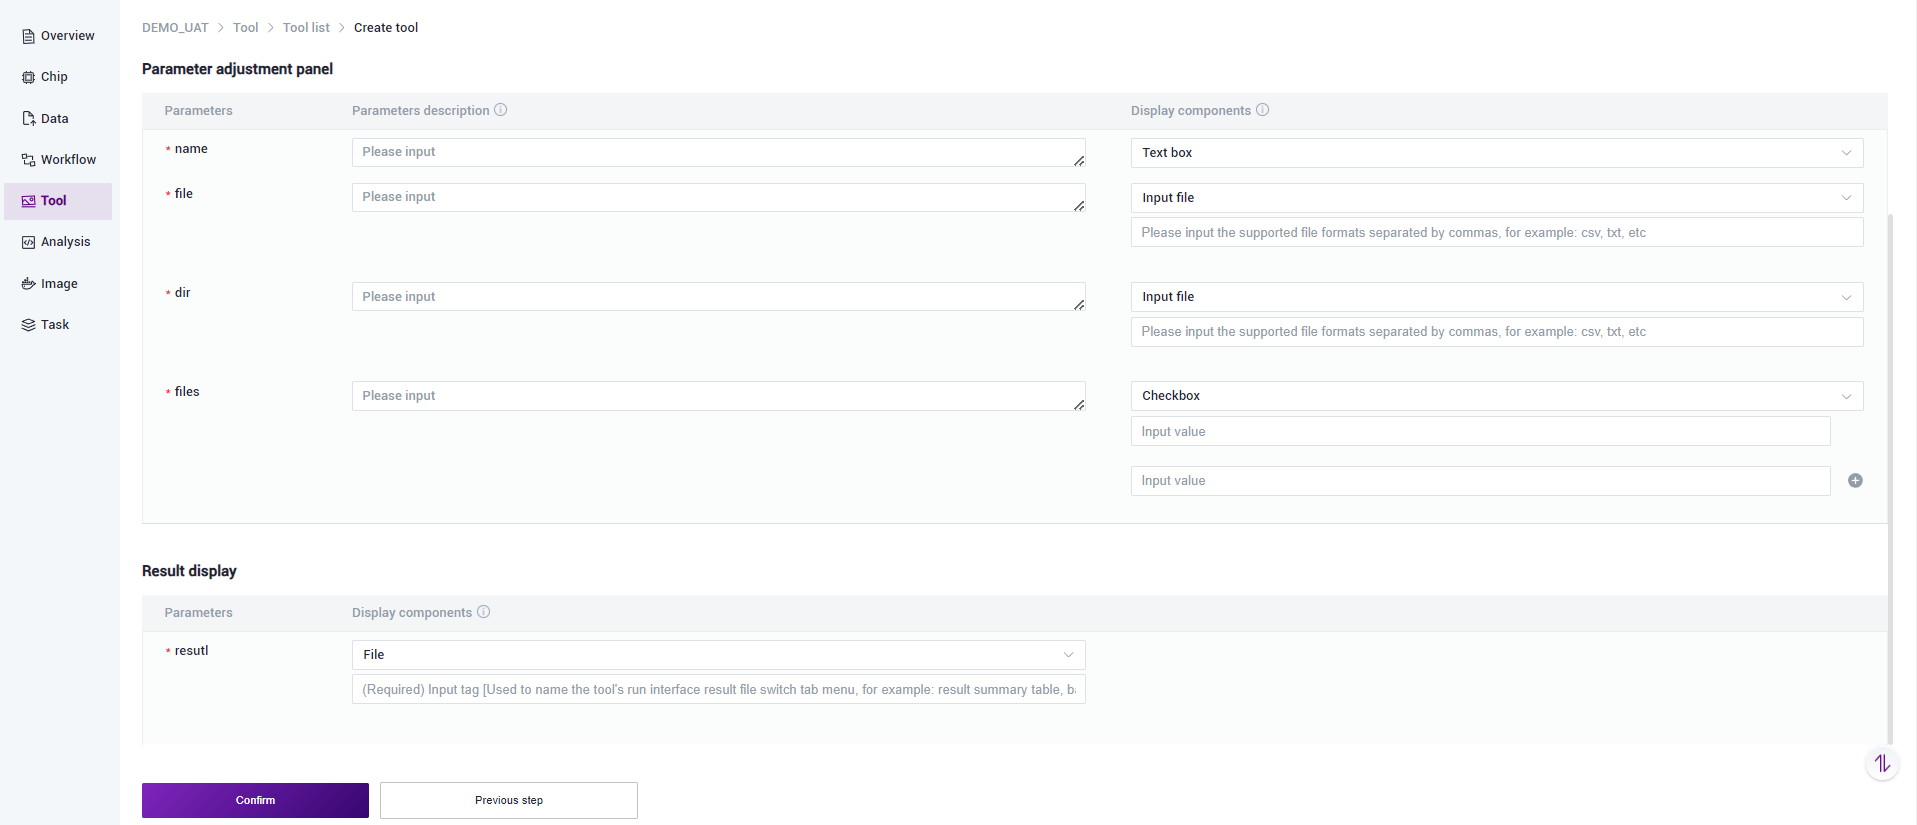
- Parameter configuration for the tuning panel: Each parameter is brought out by the input in the process analysis script. You can add a description for each parameter for the user to view the explanation of that parameter. Next, select the component information for that parameter based on the script's attributes such as File, string, etc., to match the corresponding components. The default options include: text box, radio button, checkbox, file input, and boolean value – types of components. Choose according to actual needs.
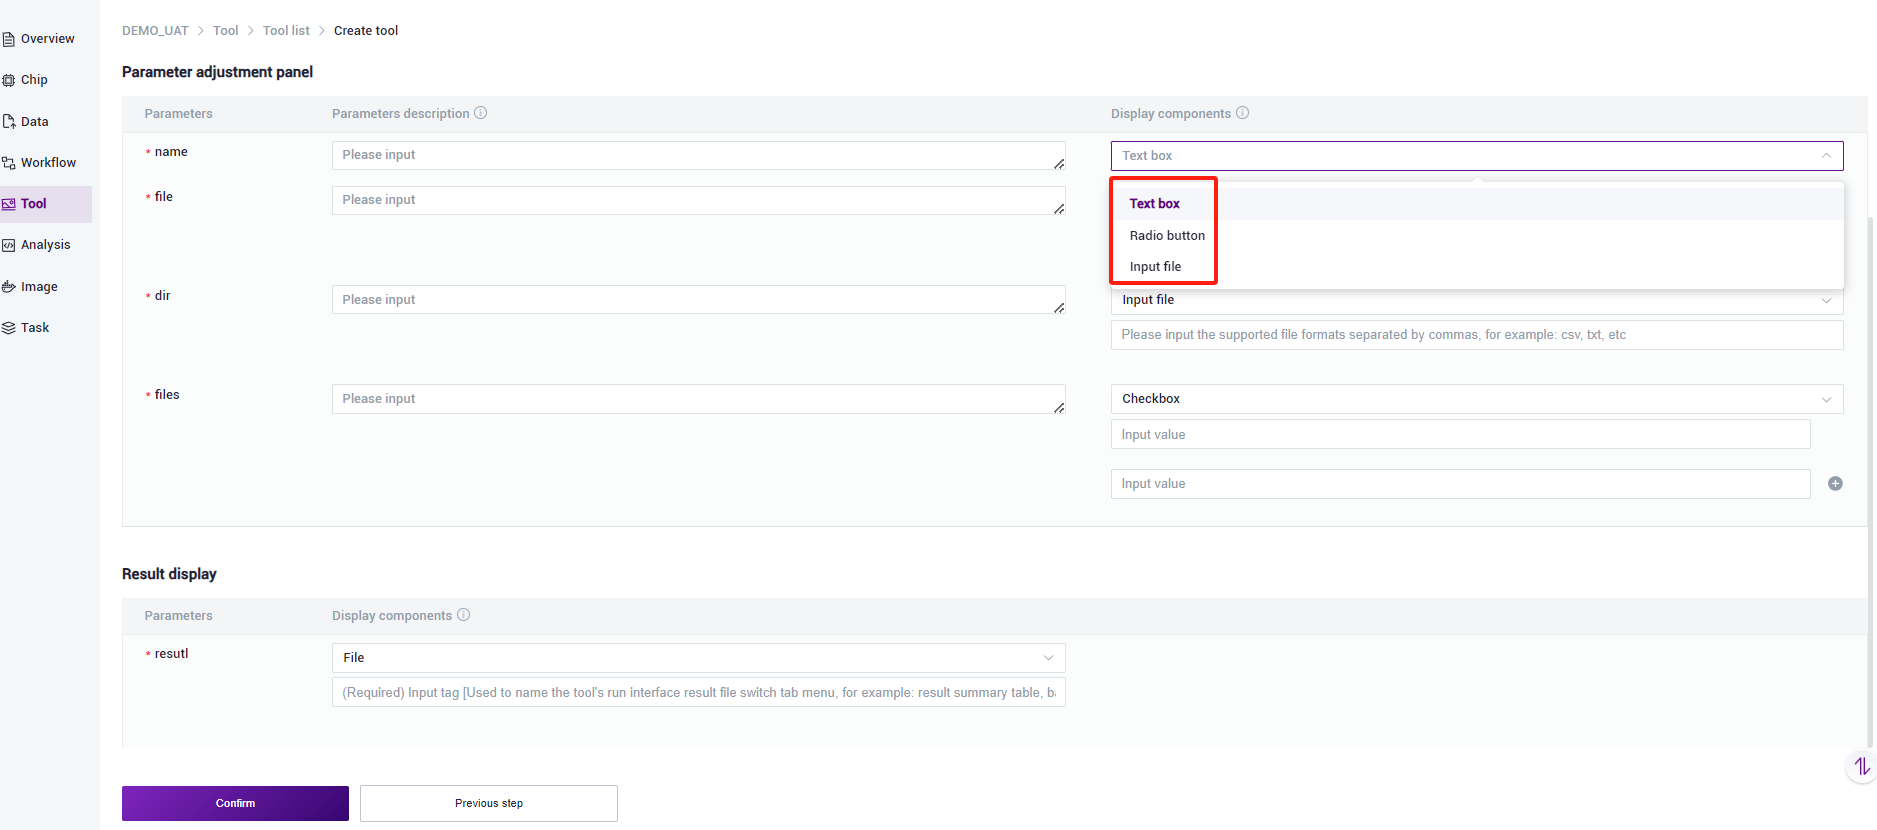
- Result Display Area Configuration: Each parameter is output from the process analysis script. Depending on the form of the actual results displayed by the tool, you can choose the corresponding component. By default, there are four components to from: image, file, table, and chart.
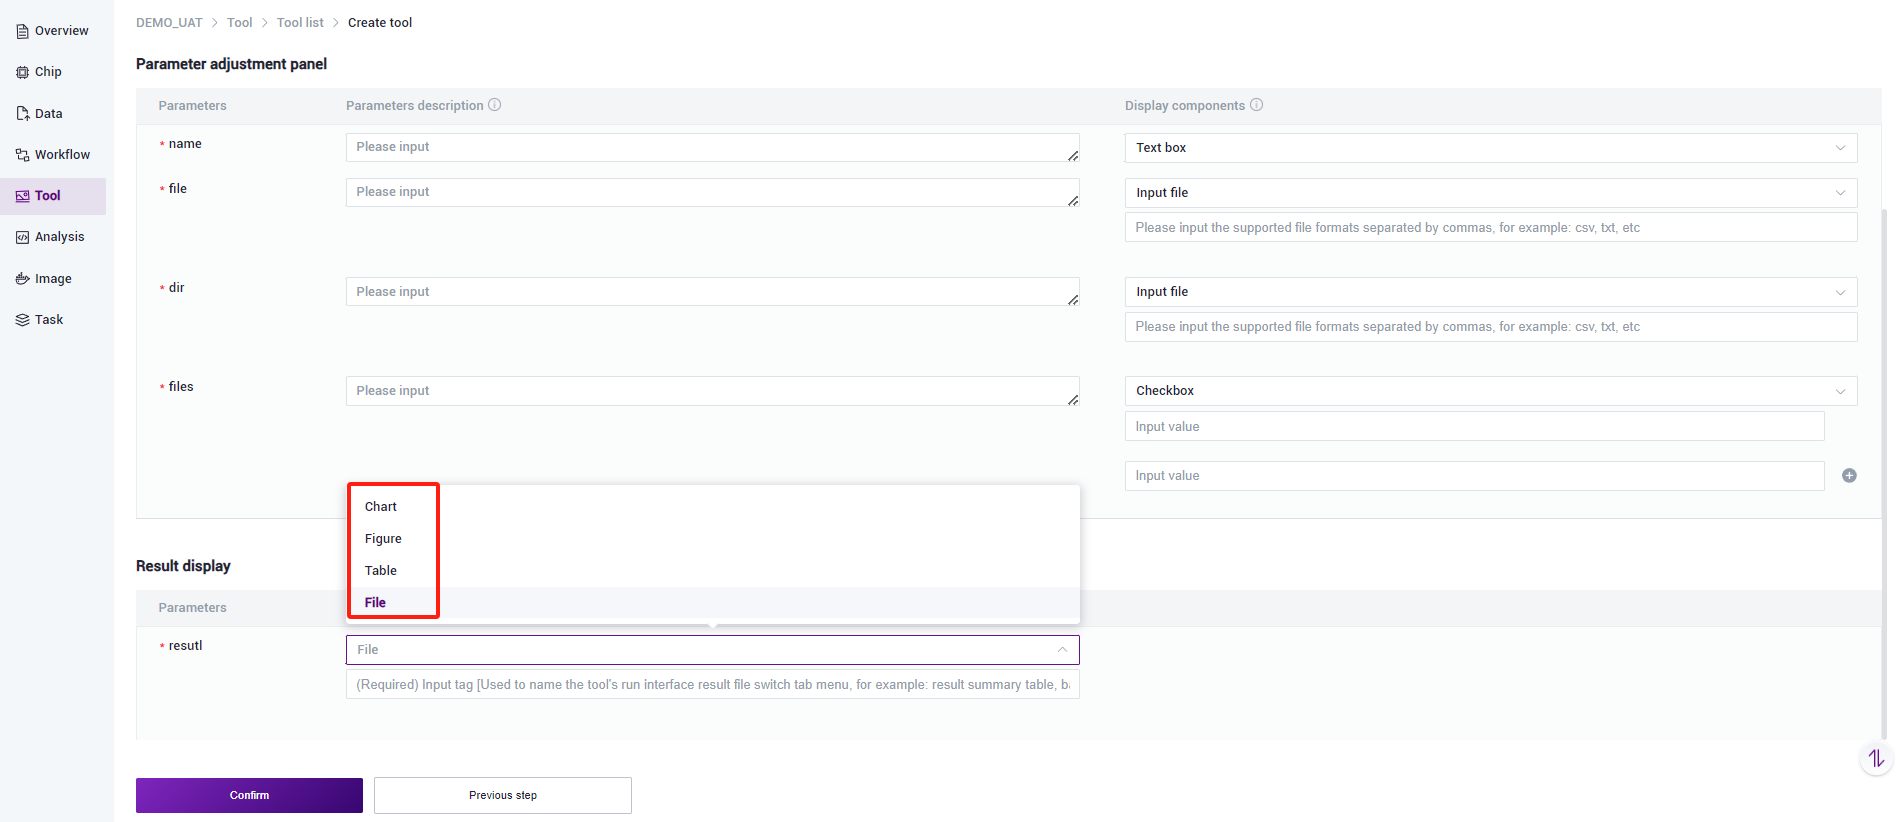
- When selecting components of type image, table, and file, it is necessary to add the filling in of tab names. The main purpose is to facilitate users to use this to switch the display of names of different result files.
Tips
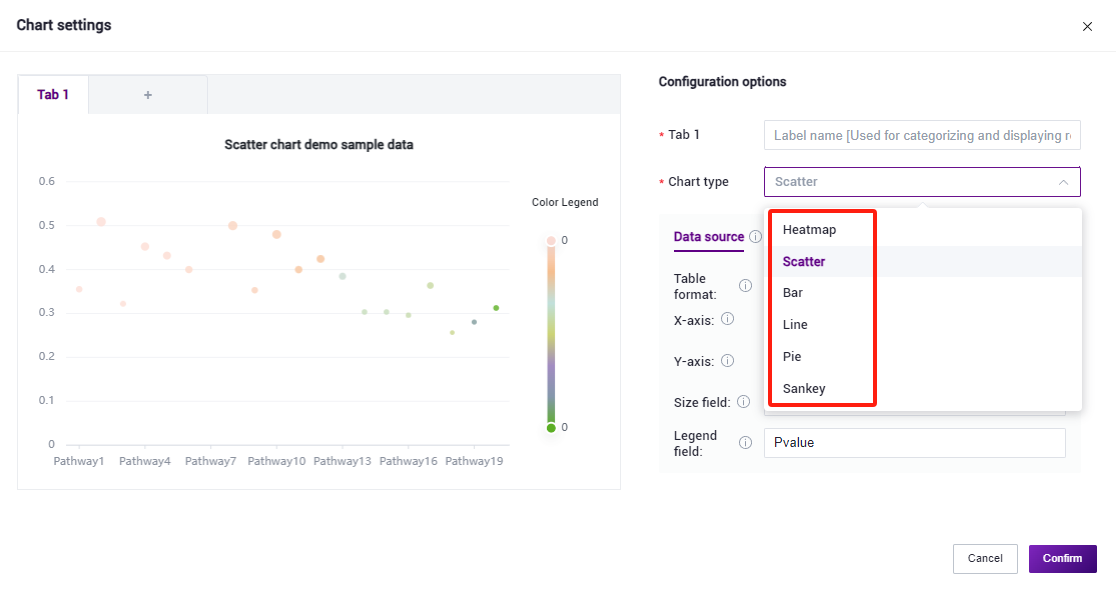
Since it is not possible to display the actual data effects when configuring this tool, we provide a demo data in the preview area for developers to view the configured chart effects in real-time. Developers can configure data sources, one-dimensional matrices, and two-dimensional matrices (specific formats for scatter plots and heat maps) based on the information in the real CSV produced by the tool to view sample data. When the CSV table is a one-dimensional matrix, the field information for the x-axis and y-axis of the chart, as well as the field information for the data source in the middle, need to be configured to complete the data source configuration. When the CSV is a two-dimensional matrix, there is no need to configure this data source information. The configuration of chart styles adjusts the display effects of the chart type, and can be changed freely according to requirements.


- Click "OK" to complete the creation of the tool.
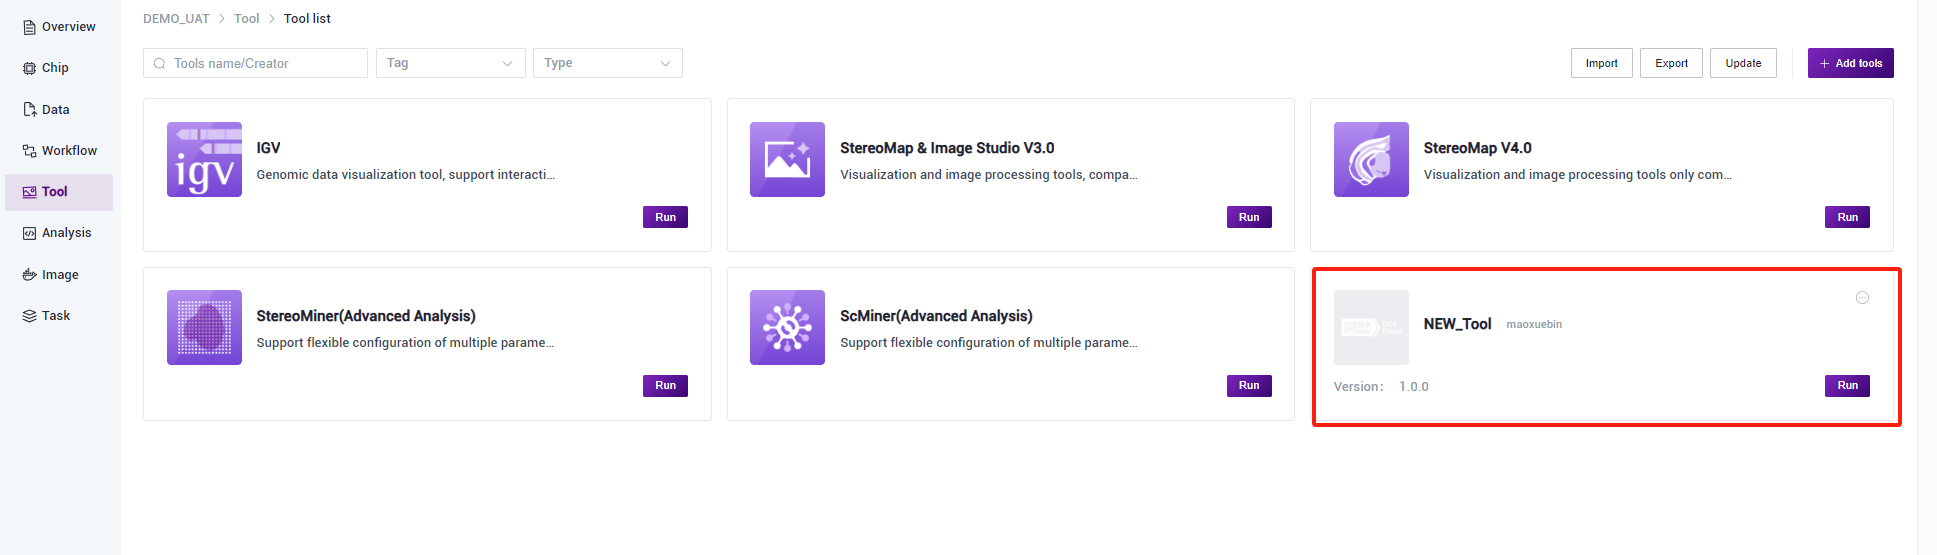
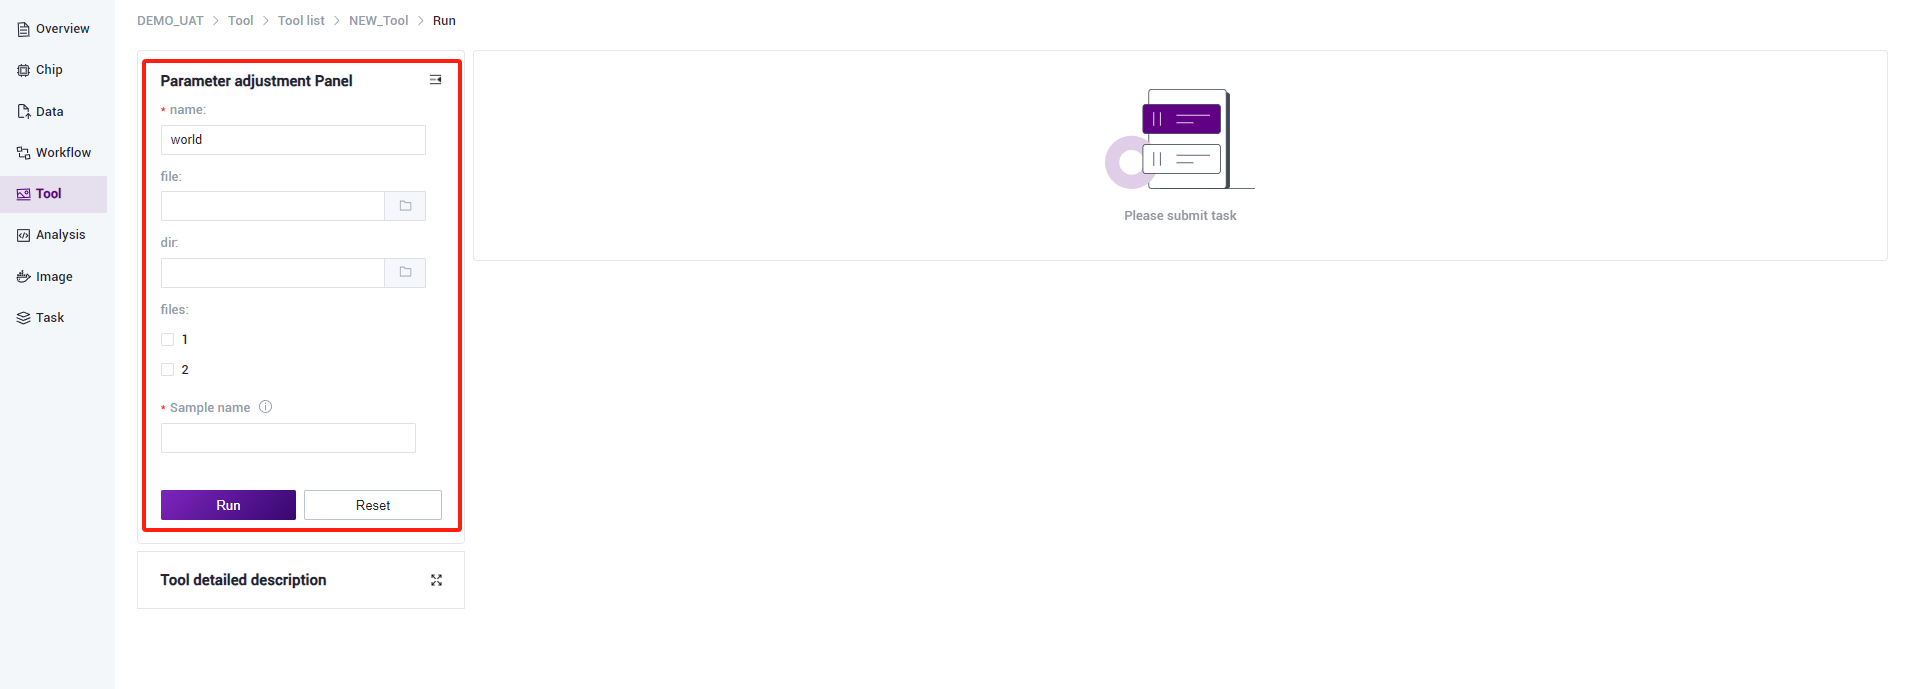
- Users click on the created tool to run a preview, and developers configure the display effects of the components in the tool.
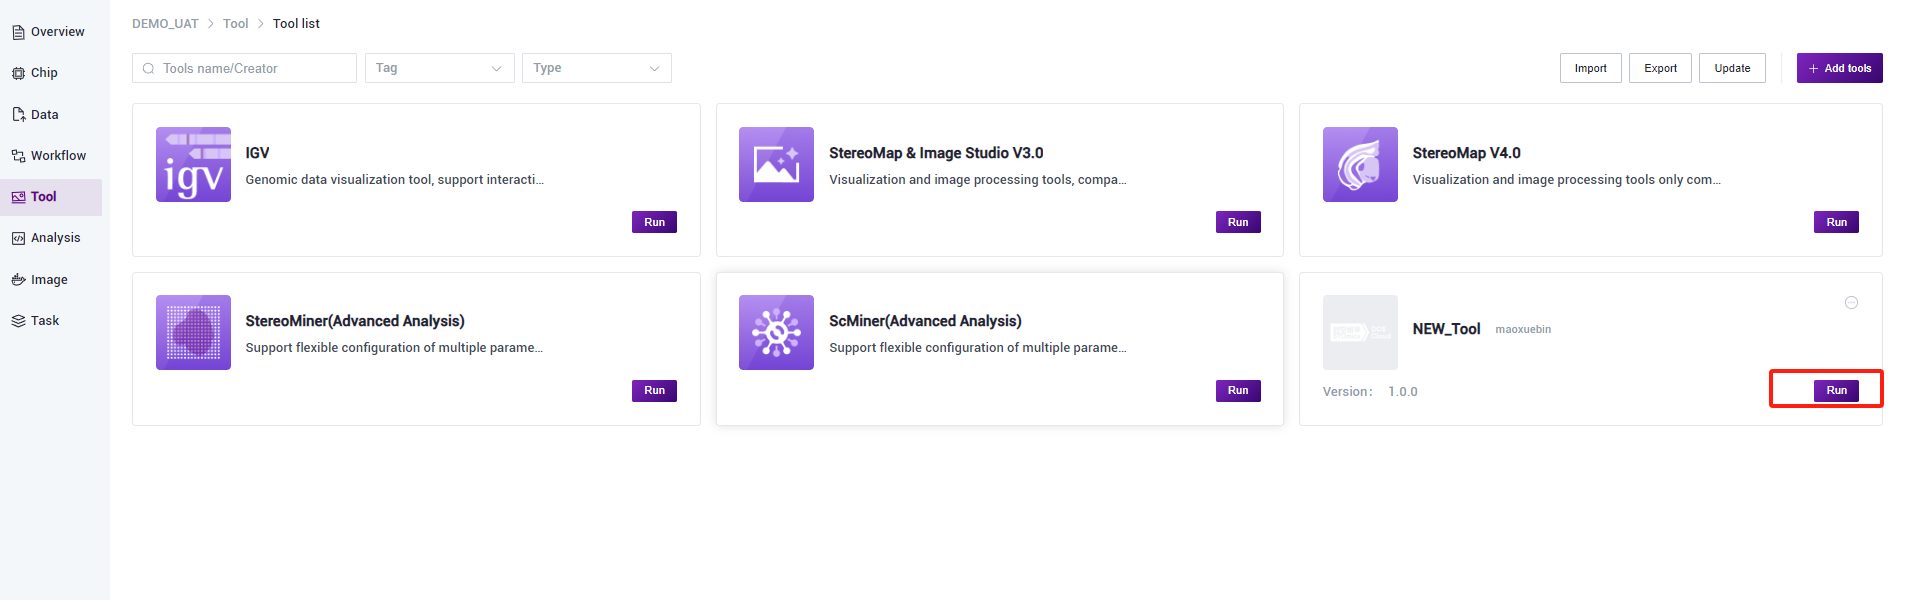
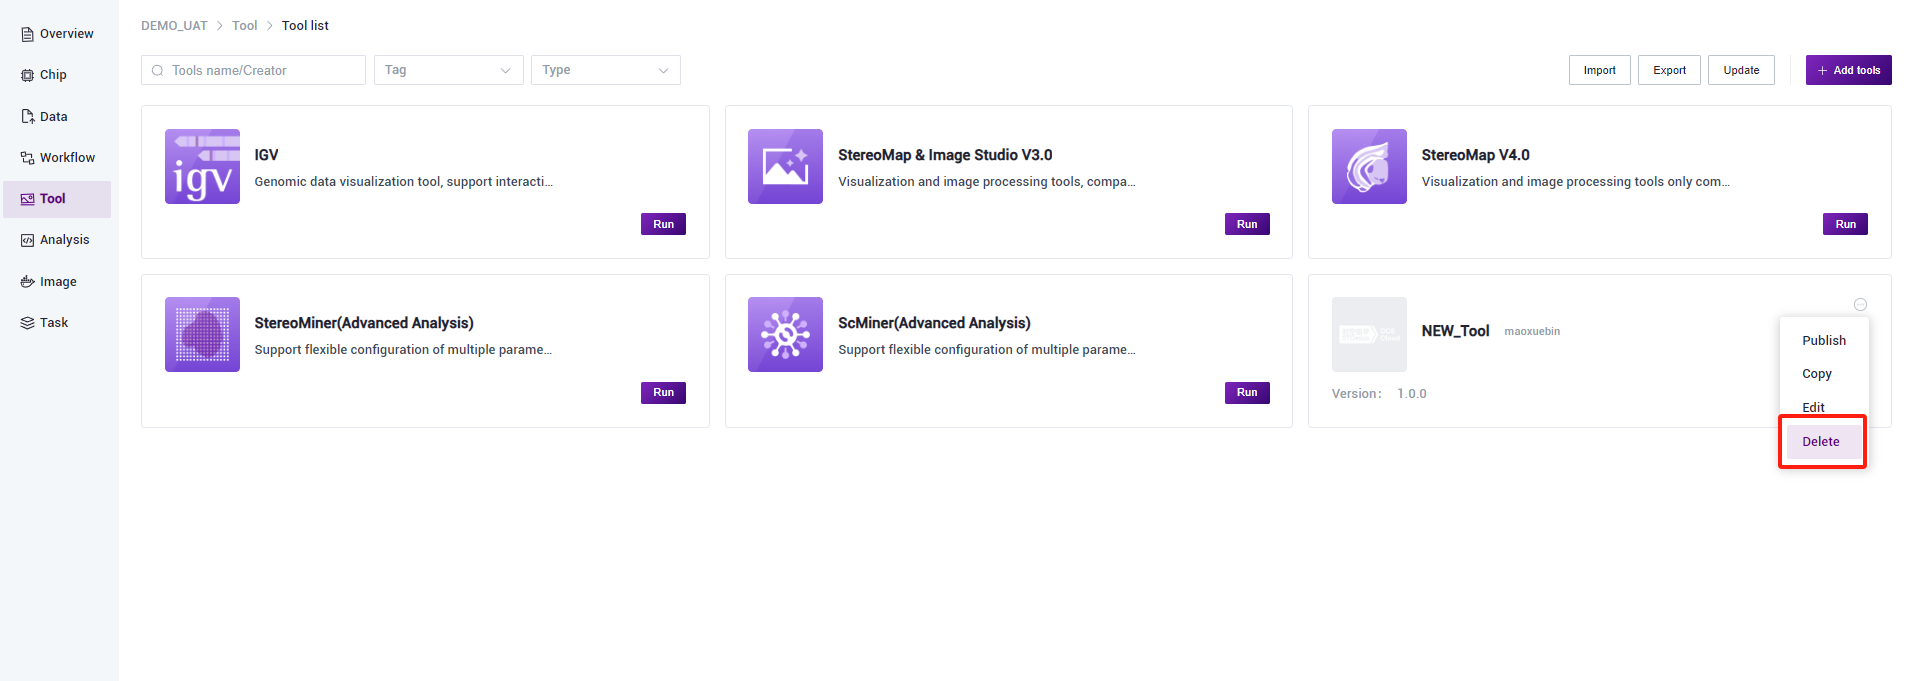
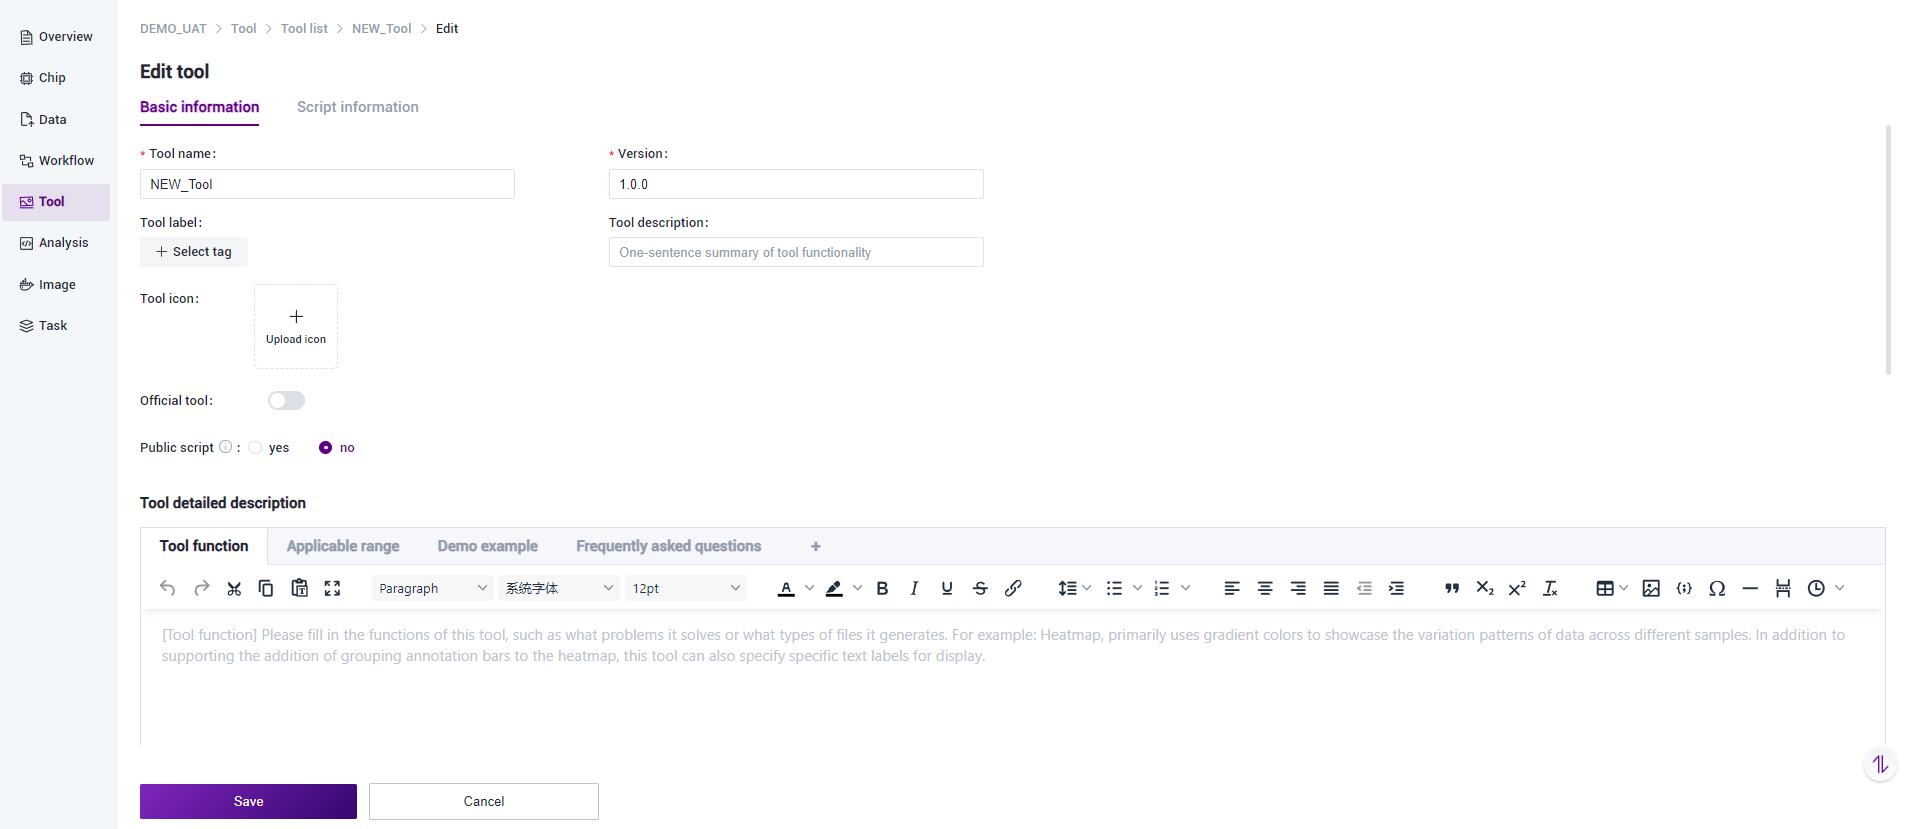
Edit Tool
When you need to modify or improve the tool, you can click the edit button, make the necessary changes, and then save the tool.
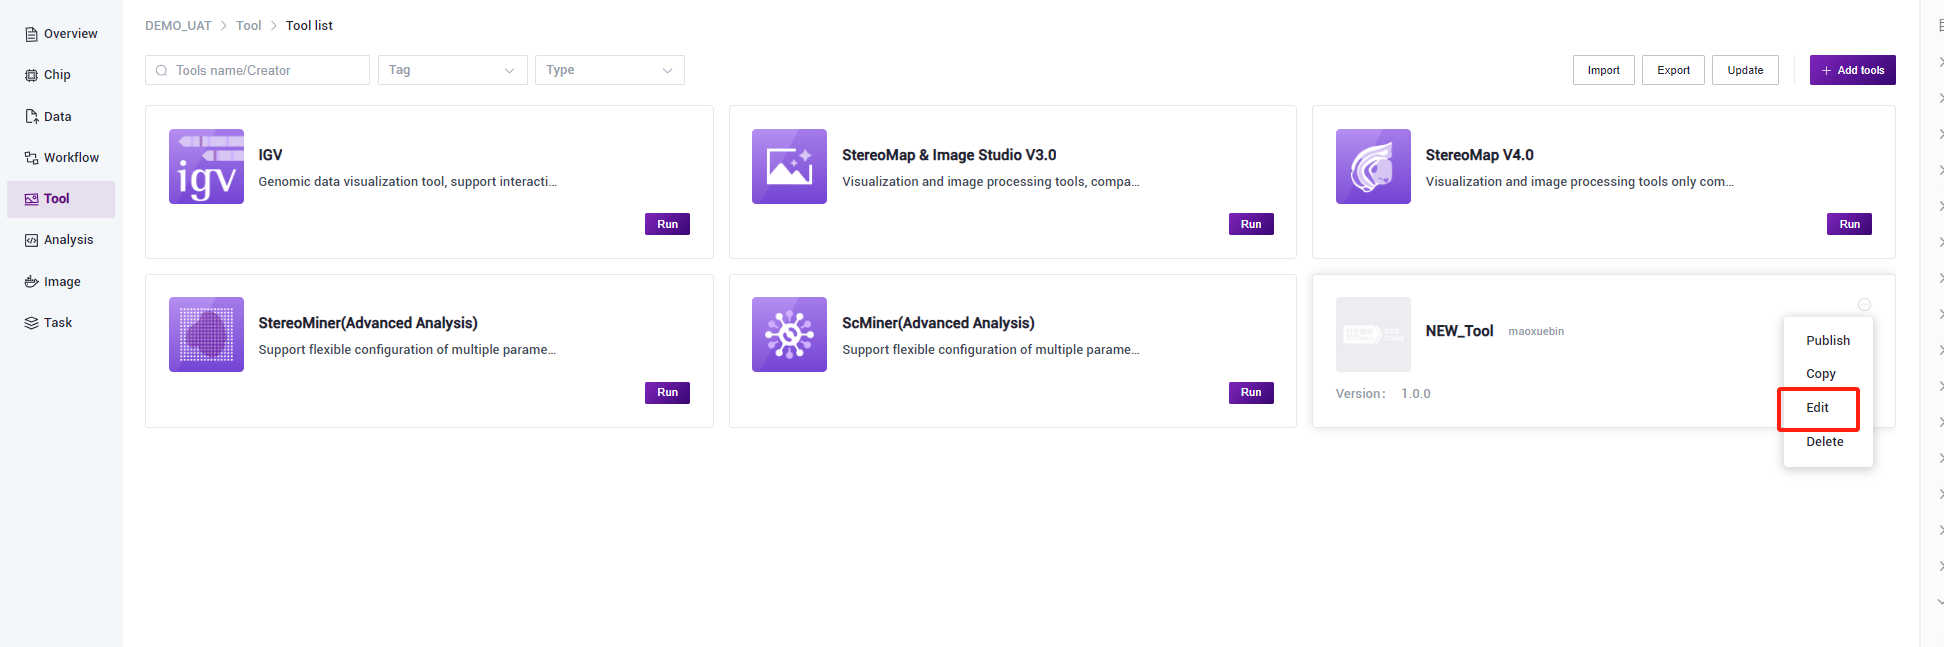
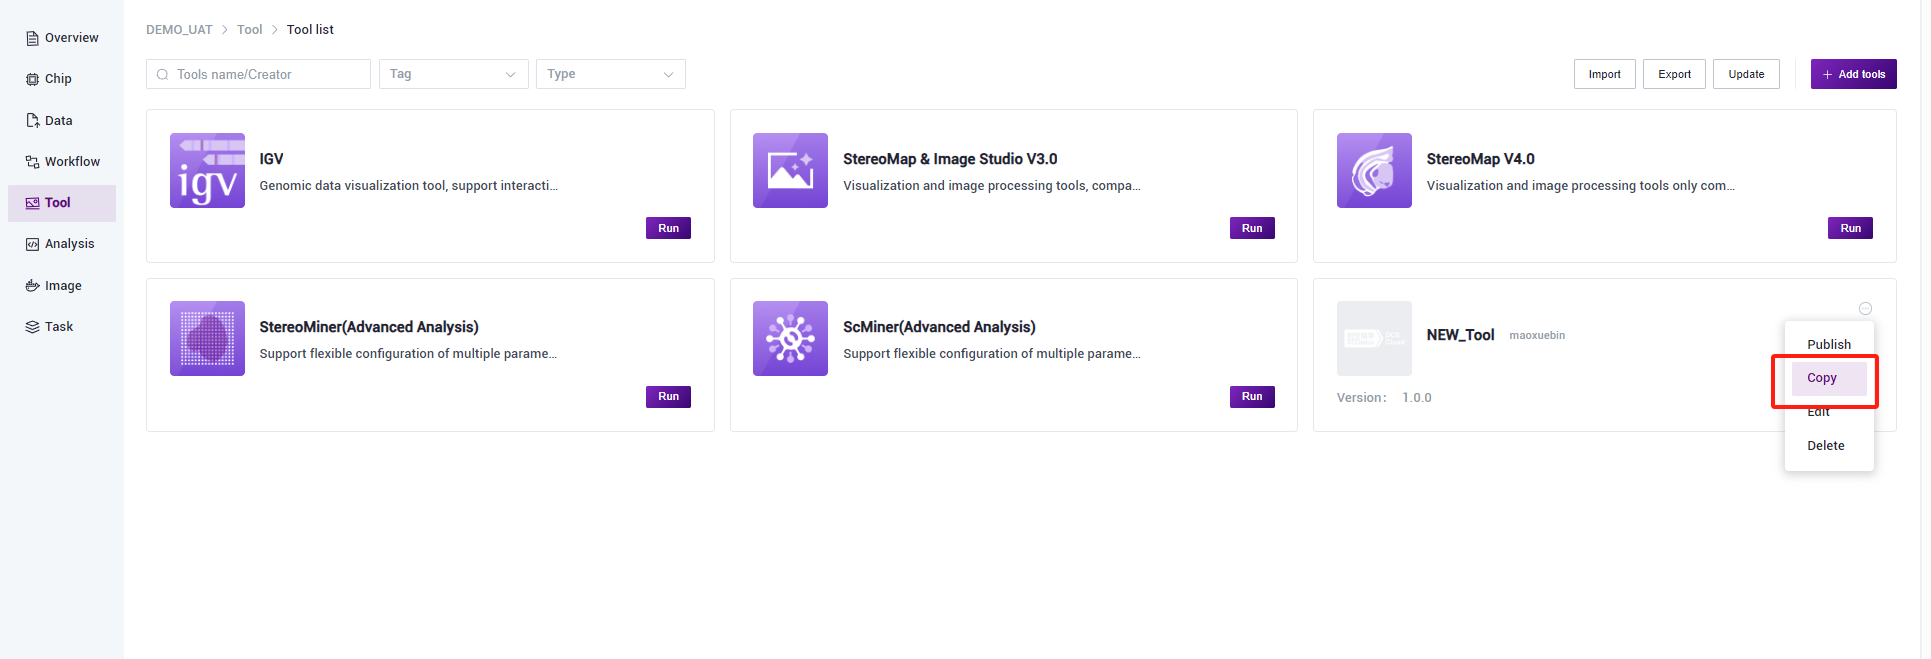
Copy Tool
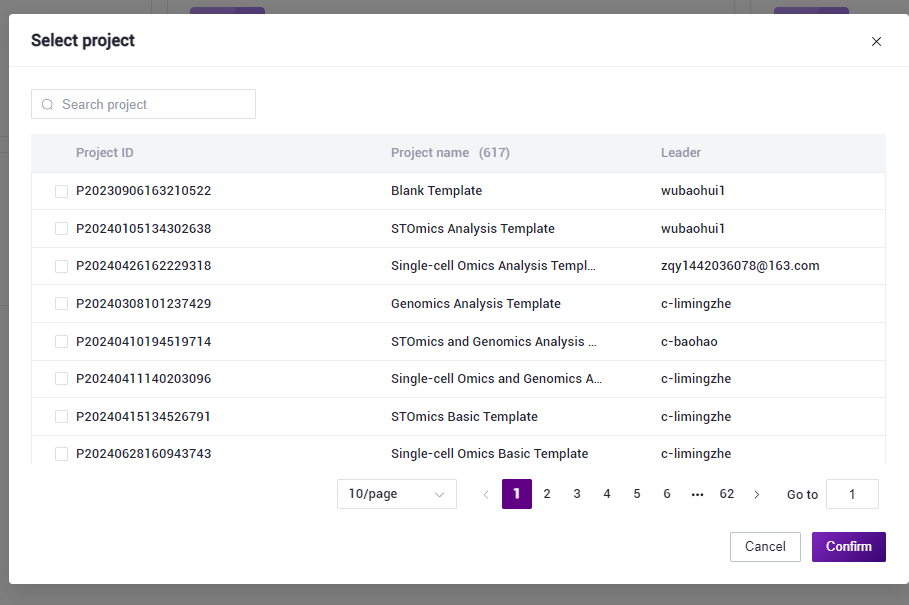
You can click the copy button to duplicate the tool to other projects where you have permissions.
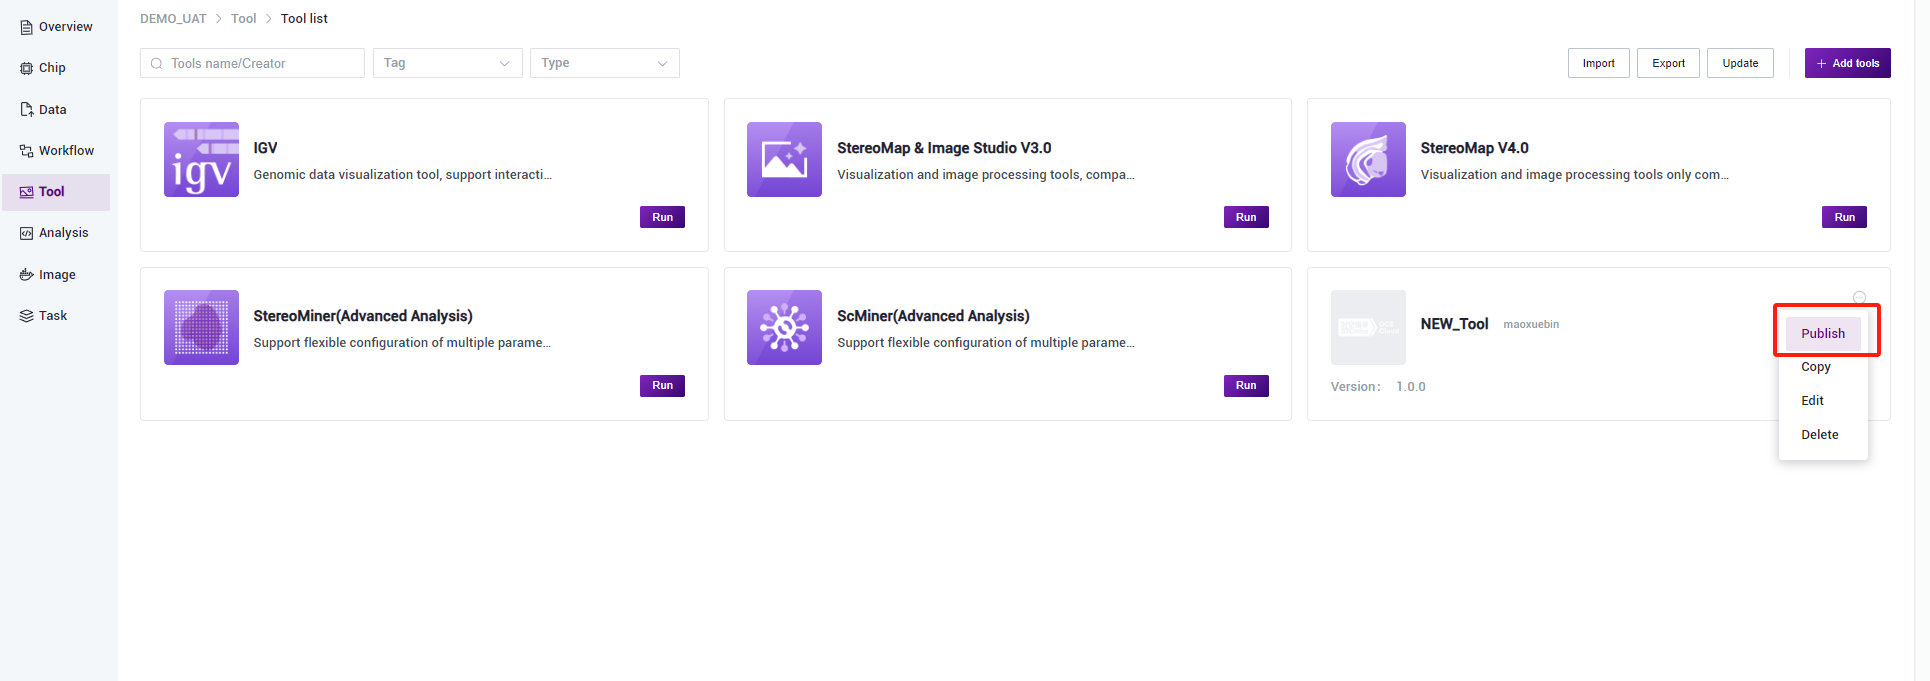
Publish Tool
The completed tool can be published by clicking the publish button, making it available for users to copy and use from the public library.
Delete Tool
By clicking the delete button, you can delete the tool.